Flavonoids comprise a diverse group of biologically active plant-derived polyphenolic compounds(Reference Beecher1) that have been associated with improved health outcomes(Reference Hooper, Kroon and Rimm2–Reference Ivey, Lewis and Lim4) and reduced risk of all-cause mortality(Reference Grosso, Micek and Godos5–Reference Ivey, Lewis and Prince7). They are found in many foods such as red wine, blueberries and tea(Reference Bhagwat, Haytowitz and Holden8). Over 4000 flavonoid compounds have been identified and grouped into one of the seven subclasses: flavonols, flavan-3-ols monomers, proanthocyandins, flavanones, flavones, anthocyanins and isoflavones(Reference Ivey, Hodgson and Croft9). These subclasses have demonstrated specific relationships with several health outcomes. For example, flavones and flavan-3-ols have been associated with lower cardiovascular mortality(Reference Raman, Avendano and Chen10), while protective associations have been observed for intake of flavonols and flavones with risk of breast cancer(Reference Hui, Qi and Qianyong11).
In order to fully understand the subclass-specific relevance of flavonoids to health and the population-level impacts of a flavonoid-rich diet, it is essential to obtain valid and reproducible intake estimates of flavonoid subclasses and the foods from which they are derived from semi-quantitative FFQ (SFFQ). This is because SFFQ are often the primary dietary assessment tool in nutritional epidemiology studies, owing to their generally valid measures of various macro- and micronutrients and the ease with which they can be administered and analysed in large-scale cohort studies(Reference Yuan, Spiegelman and Rimm12,Reference Willett13) . The validity and reproducibility of SFFQ for measuring flavonoid intake are especially important because there are few appropriate biomarkers for intake due to the short half-life of flavonoids and their metabolites, as well as the complex and underdefined microbial and human metabolism of these compounds(Reference Erlund, Silaste and Alfthan14,Reference Loke, Jenner and Proudfoot15) . However, few validation studies have considered flavonoid intake, and those that have were generally small and used only a few days of diet records or 24-h recalls to compare against SFFQ(Reference Zhang, Li and Cao16–Reference Kent and Charlton20).
To address this gap, we used data from two large validation studies of men and women, including two weighed 7-d dietary records (7DDR) to evaluate the validity and reproducibility of an SFFQ to estimate intakes of flavonoids, flavonoid subclasses and flavonoid-rich foods.
Methods
Study population
The Men’s Lifestyle Validation Study (MLVS) was conducted from 2011 to 2013 and consisted of 914 men aged 45–80 years randomly sampled from the Health Professionals Follow-Up Study, an ongoing, nationwide, prospective cohort of 51 529 US male health professionals established in 1986(Reference Grobbee, Rimm and Giovannucci21). To be eligible for participation in MLVS, participants had to have completed a 2006/2007 SFFQ administered in Health Professionals Follow-Up Study, have previously provided blood samples, currently have internet access and never have been diagnosed with CHD, stroke, cancer or major neurological disease. The Women’s Lifestyle Validation Study (WLVS) was conducted in 2010–2012 and sampled 796 women from the Nurses’ Health Study and Nurses’ Health Study-II, two prospective cohorts established in 1976 and 1989, respectively(Reference Colditz, Manson and Hankinson22,Reference Cho, Chen and Hunter23) . The inclusion criteria for WLVS were identical to those of MLVS.
We excluded participants who did not complete both SFFQ and at least one 7DDR over the course of the study. We additionally excluded those who reported extreme energy intake [men <800 or >4200 kcal/d (<3347·2 or > 17572·8 kJ/d); women <600 or >3500 kcal/d (<2510·4 or >14644·0 kJ/d)] or if they left seventy or more SFFQ items blank, resulting in 641 men and 724 women included in the final analysis (see online supplementary material, Supplemental Fig. 1).
The current study was conducted according to the guidelines laid down in the Declaration of Helsinki, and all procedures involving research study participants were approved by the Harvard T.H. Chan School of Public Health and Brigham and Women’s Hospital. Written informed consent was obtained from all subjects/patients.
Semi-quantitative FFQ
In both the MLVS and WLVS, a 152-item SFFQ was administered at baseline(Reference Yuan, Spiegelman and Rimm12), as well as at the end of the study 1 year later. Respondents were asked how often, on average, they consumed a specified amount of each food or beverage on the SFFQ during the past year with nine possible frequency categories ranging from ‘never/almost never’ to ‘≥6 times per day’. Open-ended questions were used to obtain information on usual brand and type of margarine, cooking oil, cold breakfast cereal and multivitamins. Flavonoid intakes were calculated from the questionnaire by multiplying a weight proportional to the intake frequency by the flavonoid content for the portion size specified for each food item. Intakes were then summed across all foods to obtain overall intakes for total flavonoids and several flavonoid subclasses for every individual.
Weighed 7-d dietary records
Each participant in MLVS and WLVS completed two weighed 7DDR approximately 6 months apart in order to capture seasonal variability. Each participant, therefore, completed up to 14 d of weighed diet records. The 7DDR were completed approximately 6 months apart in order to capture seasonal variability and were completed in the time between repeated SFFQ assessments. Research dietitians provided participants with detailed instructions on keeping the 7DDR (via telephone), an instructional video on DVD, a Primo Multifunction Kitchen Scale (Model P115NB; Escali Corporation) and ruler (printed on the 7DDR booklet developed by Nutrition Coordinating Center, University of Minnesota). A computerised system was used to send reminders and encouragement emails to participants on days of diet recording. Participants measured and reported gram weights for foods before and after eating, so that actual intake could be computed. They also provided recipes of all home-prepared foods, including the number of servings in the recipe and the portions of the recipes that they consumed, as well as labels of store-brand products.
Application of food composition databases to obtain flavonoid intake estimates
We used the Phenol-Explorer (PE) database, which includes detailed information on polyphenol content in 452 foods and beverages using estimates from published literature(Reference Neveu, Perez-Jimenez and Vos24), to derive flavonoid intake estimates for the 7DDR (7DDRPE). We also used PE to estimate flavonoid intake as measured by the SFFQ (SFFQPE), but additionally estimated intake using a database maintained by Harvard dietitians (available for request at https://regepi.bwh.harvard.edu/health/nutrition.html) that is largely based on USDA data (SFFQHarvard). We took these two approaches because they allowed us to investigate different sources of error in SFFQ-derived flavonoid intake estimation. Using PE to estimate flavonoid intake in both the SFFQ and 7DDR allowed us to isolate differences in intake estimation due to the measurement tool alone (i.e., not due to the food composition database)(Reference Ivey, Hodgson and Croft9). Conversely, using PE for the 7DDR and the Harvard database for the SFFQ allowed us to compare estimates of flavonoid intake from the two assessment tools without introducing the same source of errors in calculating intakes, which can inflate validity(Reference Willett13). Methods used to apply these databases to obtain intake estimates have been previously described(Reference Ivey, Hodgson and Croft9,Reference Lin, Zhang and Wu25) . The two databases differ in terms of the composition of foods included and the analytic methods used to obtain the composition estimates. Briefly, the PE database represented glycosides or aglycones in the form that they naturally occur in food, while in the Harvard database, the flavonoid compounds were expressed largely as aglycone. For details of the differences between databases, see Ivey et al.(Reference Ivey, Croft and Prince26).
We considered seven flavonoid subclasses: flavonols, flavan-3-ol monomers, proanthocyanidins (a class of flavan-3-ol polymers, limited to proanthocyanidin dimers and trimers to allow for comparison between Harvard and Phenol Explorer databases), flavanones, flavones, anthocyanins and isoflavones. Chalcones, dihydrochalcones and dihydroflavonols were also not included in the current analysis because they are typically considered precursors to many flavonoid compounds but are not flavonoids themselves.
Statistical analysis
All analyses were conducted separately in men and women. We calculated means and sd for absolute daily total flavonoid intakes and intakes for each subclass from the baseline SFFQ, the second SFFQ and average of two 7DDR.
In our primary analyses, we assessed the validity of SFFQ-derived flavonoid intake estimates by comparing intake from the second SFFQ, which assessed diet over the same period as the 7DDR collection, to intake as measured by the average of the two 7DDR using Spearman’s correlation coefficients (r s ). For total flavonoids and each subclass, we calculated r s and two-sided 95 % CI that were deattenuated for random measurement error in the 7DDR using a method to account for the variable number of repeats of the 7DDR(Reference Rosner and Glynn27–Reference Rosner and Willett29). We adjusted r s for total energy intake using the residual method(Reference Willett and Stampfer30) with a reference energy level of 1600 kcal for women and 2000 kcal for men. We additionally calculated r s that were deattenuated but not adjusted for total energy intake. We determined reproducibility of the SFFQ by calculating rank intraclass correlation coefficients (ICC) comparing intakes from the first SFFQ to those from the second SFFQ. We calculated ICC that were adjusted and not adjusted for total energy intake. To reduce the influence of extreme nutrient intakes, ICC were based on the ranks of the log-transformed and energy-adjusted nutrient values(Reference Yuan, Spiegelman and Rimm12,Reference Rosner and Glynn27) .
In secondary analyses, we determined the validity and reproducibility of the SFFQ for measuring intake of the top three food contributors to each flavonoid subclass according to the second SFFQ. For isoflavones, we considered only the top two contributors because subsequent contributors were composite group which included soya as a minor ingredient. We did this using the same analytic approach that we used for flavonoids in our primary analyses. We additionally explored whether the SFFQ adequately captured the absolute intake and variance of these top flavonoid contributors. We did this by calculating, in the 7DDR, the mean flavonoid intake and variance in intake that were captured by items listed on the SFFQ. We also summarised the mean intake and variance in the intake from foods not represented by the SFFQ that contributed to intake of each flavonoid subclass.
All analyses were conducted using SAS version 9.4.
Results
Most study participants were white (men 98 %; women 90 %) and had overweight (men 45 %; women 30 %) or obesity (men 13 %; women 22 %). Only 1 % of men and 2 % of women were current smokers. At baseline, men had a mean age of 67 (sd 8) years, and women had a mean age of 62 (sd 10) years (Table 1).
Table 1 Baseline characteristics and dietary intake of participants in the Men’s Lifestyle Validation Study and Women’s Lifestyle Validation Study

* Values are presented as means and sd or percentages where appropriate.
† Dietary intake from the second semi-quantitative FFQ.
‡ 1 kcal = 4·184 kJ.
According to the 7DDRPE intake estimates, the mean total flavonoid intake was 356 (sd 241) mg/d for men and 328 (sd 250) mg/d for women (Table 2). Total flavonoid intakes estimated from SFFQPE were slightly higher in women, but not in men. Intakes of most flavonoid subclasses were generally similar between SFFQPE and 7DDRPE. However, estimated intakes of flavan-3-ol monomers were substantially higher when measured by the SFFQPE (58 and 68 % higher in SFFQPE than 7DDRPE in men and women, respectively), and intakes of flavonols were substantially higher when measured by the 7DDRPE (39 and 38 % lower in SFFQPE than 7DDRPE in men and women, respectively). For total flavonoids, flavonols, flavan-3-ol monomers, flavones and isoflavones, SFFQHarvard intakes were substantially lower than SFFQPE intakes. SFFQ-estimated intake of proanthocyanidins, flavanones and anthocyanins was generally similar when using either the Harvard or PE database. For any given flavonoid subclass, the top whole food contributors to that subclass, as measured by the second SFFQ, were generally the same between men and women. However, the percentage of intake accounted for by the top three food contributors varied by subclass. In men, this ranged from 45 % (flavonols) to 91 % (flavanones); in women, it ranged from 43 % (flavones) to 90 % (flavanones).
Table 2 Mean (and sd) flavonoid intakes (mg/d) in Men’s Lifestyle Validation Study and Women’s Lifestyle Validation Study as estimated by two semi-quantitative FFQ (SFFQ) and two 7-d dietary records

7DDRPE, weighed 7-d diet record derived using Phenol-Explorer; SFFQ1, first semi-quantitative FFQ; SFFQ2, second semi-quantitative FFQ; SFFQHarvard, semi-quantitative FFQ derived using the Harvard database; SFFQPE, semi-quantitative FFQ derived using the Phenol-Explorer database.
* Values are for the average of 2 weeks of weighed diet records.
† Foods are as estimated from the second SFFQ using the Harvard food composition database. The numbers in parentheses are the percentages that the food contributes to mean intake of that flavonoid subclass.
‡ Includes proanthocyanidin dimers and trimers.
§ Other contributors were composite foods.
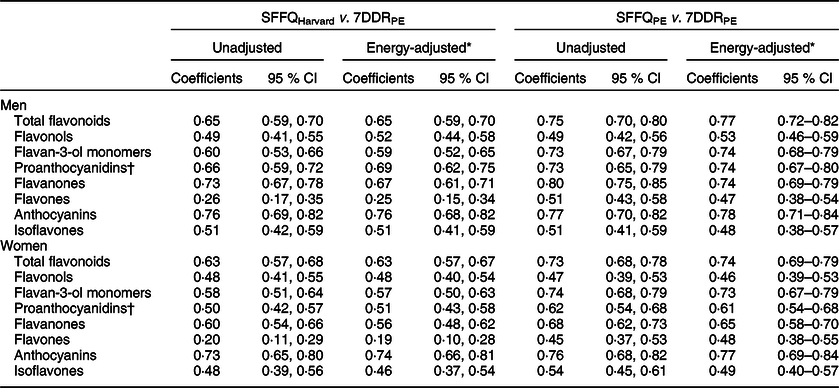
The second SFFQPE generally demonstrated moderate (0·4–0·7) to high (≥0·7) validity as assessed by Spearman’s correlation coefficients for measuring intake of total flavonoids and flavonoid subclasses compared with the average of two 7DDRPE (Table 3). The deattenuated, energy-adjusted r s for total flavonoid intake was 0·77 (95 % CI 0·72, 0·82) for men and 0·74 (95 % CI 0·69, 0·79) for women. The r s for intake of flavonoid subclasses ranged from 0·47 for flavones to 0·78 for anthocyanins in men and from 0·46 for flavonols to 0·77 for anthocyanins in women. Results for all were similar when not adjusting for total energy intake. Results were similar or slightly weaker when using SFFQHarvard. We observed the strongest difference between databases for measuring intake of flavones (r s = 0·25 in men and 0·19 in women).There was moderate to high agreement (r s ≥ 0·43) in the ranking of flavonoid subclass consumers between SFFQPE and SFFQHarvard, with the exception of flavones (r s ≤ 0·12), despite differences in absolute intakes (see online supplementary material, Supplemental Table 1).
Table 3 Deattenuated Spearman’s correlation coefficients and 95 % CI comparing flavonoid intake as measured by the second semi-quantitative FFQ with intake as measured by the average of 2 weeks of 7-d diet records in Men’s Lifestyle Validation Study and Women’s Lifestyle Validation Study

7DDRPE, weighed 7-d diet record derived using Phenol-Explorer; SFFQHarvard, semi-quantitative FFQ derived using the Harvard database; SFFQPE, semi-quantitative FFQ derived using the Phenol-Explorer database.
* Adjusted for total energy intake using the residual method.
† Includes proanthocyanidin dimers and trimers.
The SFFQ demonstrated high reproducibility when comparing total flavonoid intake estimates from two assessments 1 year apart in both men (ICCHarvard = 0·78, ICCPE = 0·80) and women (ICCHarvard = 0·71, ICCPE = 0·75) (Table 4). The ICC for SFFQPE flavonoid subclasses ranged from 0·69 (flavonols) to 0·80 (proanthocyanidins) in men and from 0·68 (anthocyanins) to 0·77 (flavan-3-ol monomers) in women. The ICC ranges were similar for the SFFQHarvard. As for 7DDR, the ICC was generally lower than SFFQ, ranging from 0·39 (isoflavones) to 0·67 (flavanones) in men and from 0·39 (flavones and isoflavones) to 0·62 (flavonols) in women (see online supplementary material, Supplemental Table 2). These results were similar when not adjusting for total energy intake.
Table 4 Rank intraclass correlation coefficients comparing flavonoid intake from the first and second semi-quantitative FFQ in Men’s Lifestyle Validation Study and Women’s Lifestyle Validation Study

SFFQHarvard, semi-quantitative FFQ derived using the Harvard database; SFFQPE, semi-quantitative FFQ derived using the Phenol-Explorer database.
* Adjusted for total energy intake using the residual method.
† Includes proanthocyanidin dimers and trimers.
When we identified items in the 7DDR that were assessed on the SFFQ and calculated their total flavonoid intake, we found that these items accounted for 95 and 96 % of the total flavonoid intake in men and women, respectively (see online supplementary material, Supplemental Table 3). SFFQ foods captured the vast majority (≥92 %) of 7DDR intake for all flavonoid subclasses except for anthocyanins, which accounted for only 75 % of intake in men and 76 % in women. In post hoc analyses, we found that this discrepancy was largely due to the absence of cherries from the SFFQ food list, which contributed 7·4 mg/d (13 %) to 7DDR anthocyanin intake in men and 4·9 mg/d (13 %) in women. Blackberries, raspberries and cranberries also contributed >1 % of 7DDR anthocyanin intake in both men and women. For flavones, the SFFQ foods accounted for 94 % of 7DDR intake in men and 92 % in women. Artichokes, which were not listed on the SFFQ, accounted for 0·4 mg/d (4 %) and 0·4 mg/d (5 %) of the 7DDR flavone intake in men and women, respectively. We also found that the foods represented by the SFFQ captured most of the variance in subclass intake, though anthocyanins and flavones similarly had the least amount of variance explained by SFFQ foods (see online supplementary material, Supplemental Table 4).
Using 7DDR as the reference method, the SFFQ demonstrated moderate to high validity for ranking all major food contributors to flavonoid intake, with similar results for men (mean r s = 0·75) and women (mean r s = 0·68); see Table 5. Among the major food contributors to flavonoid intake, the SFFQ demonstrated the strongest validity for red wine intake and orange juice in both men (r s = 0·88, 95 % CI 0·85, 0·91 for red wine; r s = 0·88, 95 % CI 0·85, 0·90 for orange juice) and women (r s = 0·83, 95 % CI 0·80, 0·86 for red wine; r s = 0·82, 95 % CI 0·79, 0·85 for orange juice). The SFFQ demonstrated the poorest validity for intake of onion in men (r s = 0·43, 95 % CI 0·34, 0·51) and women (r s = 0·48, 95 % CI 0·37, 0·56). The SFFQ estimated food intakes for all major flavonoid contributors were highly reproducible in both men and women, except for oranges (ICC = 0·40 for men and ICC = 0·37 for women) and orange juice (ICC = 0·40 for men and ICC = 0·38 for women). Men reported higher intakes of all major food contributors to flavonoid intake than women, but women consumed more tea in both the SFFQ and 7DDR (see online supplementary material, Supplemental Table 5). When compared with the 7DDR, the SFFQ tended to overestimate intakes of major food contributors to flavonoid intake, particularly apples, blueberries, onions and tofu. However, tea intake was consistently lower for the SFFQ than the 7DDR.
Table 5 Validity and reproducibility estimates by semi-quantitative FFQ (SFFQ) for major food contributors to flavonoid intake in Men’s Lifestyle Validation Study and Women’s Lifestyle Validation Study (reference methods: 7-d dietary records (7DDR))

ICC, rank intraclass correlation coefficient; r s , Spearman’s rank correlation coefficient.
* Values represent r s comparing the second SFFQ with the average of 2 weeks of weighed 7DDR.
† Values represent the ICC comparing the first and second SFFQ.
‡ The r s not deattenuated for random measurement error because of high within-person variation in intake (see online supplementary material, Supplemental Table 6).
Discussion
The 152-item SFFQ used in the current study generally demonstrated moderate to high validity for measuring intake of total flavonoids and major flavonoid subclasses when compared with the intake from two weighed 7DDR. This was true when using either the PE- or Harvard-based food composition databases, but not for flavones when estimated using the Harvard database. The SFFQ also showed high reproducibility for measuring intake of these compounds when comparing estimates from SFFQ 1 year apart. The SFFQ demonstrated moderate to high validity for measuring intake of all major food contributors to flavonoid subclass intakes except for onions. The current study highlights that this SFFQ is appropriate for ranking individuals by flavonoid intake, which is often the primary goal of dietary assessment in nutritional epidemiology studies, even when absolute intakes differ from the gold standard. This SFFQ has previously demonstrated moderate to high validity for measuring other major nutrients in WLVS (mean r s = 0·64 among forty-four nutrients)(Reference Yuan, Spiegelman and Rimm12).
Few previous studies have evaluated the validity and reproducibility of SFFQ to measure flavonoid intake. Three studies conducted in China observed similar but slightly higher validity estimates than we did for flavonols and flavones(Reference Zhang, Li and Cao16–Reference Sun, Wang and Wang18); however, these studies compared SFFQ with 24-h recalls, whose errors are expected to be more highly correlated with SFFQ than diet records because both 24-h recalls and SFFQ rely on participant memory(Reference Willett13). Also, two of these studies were conducted in adolescents or young adults, making it difficult to compare results with the current study. Two other studies, which were conducted in Australia, evaluated the validity of an SFFQ specifically designed to capture flavonoid intake, whereas the current study evaluated an SFFQ designed to capture overall diet. Despite these differences, validity estimates for several flavonoid subclasses were similar or higher for the SFFQ in the current study than for this specialised SFFQ(Reference Somerset and Papier19,Reference Kent and Charlton20) . However, these two Australian studies only used 3- or 4-d diet records and had very small sample sizes (n 60 and n 42 participants, respectively). Compared with these previous studies, our study thus had a very large sample size and used two repeated implementations of 7DDR, capturing a total of 14 d of dietary intake, which is well above the minimum number of days of weighed diet records needed for accurately capturing flavonoid intake(Reference Caldwell, Charlton and Lee31).
The relatively high validity estimates we observed for most flavonoid subclasses are likely because most of their top food contributors were measured with good accuracy by the SFFQ compared with 7DDR (generally r s > 0·65). The SFFQ demonstrated poorer ability to accurately measure intake of flavones and flavonols. This may be due to the fact that both of these subclasses are found in a variety of foods(Reference Bhagwat, Haytowitz and Holden8), some of which may not be measured accurately by the SFFQ. The lower r s estimates for flavonols, in particular, are likely partially due to the SFFQ’s poorer ability to measure onion intake, which is the top contributor to this flavonoid subclass. For flavones, we noted that artichokes and oregano, which contributed significantly to total intake and the variance in intake, were not assessed by the SFFQ. Future investigations that seek to identify the role of flavones in health should consider adding these foods to existing SFFQ. We also noted that the absence of cherries, blackberries, raspberries and cranberries from the SFFQ food list could underestimate estimation of anthocyanin intake because these foods contributed substantially to total intake and variance in intake (except for cranberries) in the 7DDR. However, the SFFQ demonstrated good ability to measure anthocyanin intake despite the fact that these foods were not assessed.
With the exception of flavones, the estimated validity of the SFFQ to measure flavonoid intakes did not appear to be driven by the choice of which food composition database to apply to the SFFQ; we observed similar results when using both the PE and Harvard databases. Using either database alone has the potential to introduce bias to validity estimates. Comparing SFFQ and 7DDR intake estimates using the same food composition database (i.e., SFFQPE v. 7DDRPE) might introduce the same source of errors in calculating intake and thereby overestimate true validity; conversely, comparing these assessment tools using different databases (i.e. SFFQHarvard v. 7DDRPE) incorporates error that is not solely due to differences in the tools’ measurement ability, thereby underestimating true validity(Reference Willett13). Indeed, when compared against 7DDRPE, nearly all r s were slightly lower when estimating intake from SFFQHarvard than from SFFQPE. However, this discrepancy was small for total flavonoid and flavonoid subclasses (other than flavones), highlighting the robustness of our findings. The larger differences we observed for flavone intake between the two databases may be because absolute flavone intake estimates from SFFQPE were more than four times greater than from SFFQHarvard, which was a larger discrepancy than for any other flavonoid subclass. Perhaps more importantly, there was also poor agreement in ranking participants by intake of flavones between the two methods. We have previously shown(Reference Ivey, Croft and Prince26) that application of the USDA and PE databases to a different FFQ resulted in participants being ranked differently based on their flavone intake estimates. This lack of agreement was due to differences in the flavone concentration of foods between the two databases as well as analytic differences between the two databases. Primarily, the high proportion of C-glycosides making up this subclass is difficult to hydrolyse, and the data in the USDA database present hydrolysed values only. Thus, the flavone intake estimates from the Harvard database, which is based upon the USDA database, are expected to be lower than estimates from PE. It is worth noting that flavones were minor contributors to total flavonoid intake. Thus, even with these discrepancies in flavone estimates, our total flavonoid estimates were still valid.
To our knowledge, this is the largest validation study of an SFFQ for measuring flavonoid intakes compared with 7DDR, but it has limitations. Participants in the current study were all health professionals, and the vast majority were White. Our results may therefore not be generalisable to other populations, such as those with large proportions of non-White individuals and individuals who are not in healthcare professions. Additionally, diet records have their own sources of errors, including the fact that participants may change their normal eating habits when completing the records(Reference Willett13). If these errors were uncorrelated with errors in completing the SFFQ, the validity of the SFFQ could be underestimated. On the other hand, if the errors were correlated, which could occur due to use of the same food composition database, the validity of the SFFQ could be overestimated. However, we observed fairly high validity and reproducibility estimates for total flavonoids and most subclasses when using either of two different databases to derive SFFQ intake, increasing the robustness of our findings. Finally, isoflavone intake was relatively low and very skewed (see online supplementary material, Supplemental Fig. 2) in our study population. Therefore, the validity of SFFQ for measuring isoflavones may not be generalisable to populations with high isoflavone intakes, such as Asian populations.
In conclusion, the 152-item SFFQ demonstrated reasonable validity and reproducibility for measuring intake of total flavonoids and most flavonoid subclasses compared with the mean of two 7DDR assessments, regardless of the food composition database used. Intake of flavonoid-rich foods was also measured with generally high validity and reproducibility. Future investigations that seek to determine the health effects of specific flavonoid subclasses (mainly flavonols and flavones) should consider supplementing questionnaires with additional food items that may be informative for ranking individuals’ intake.
Acknowledgements
Acknowledgements: The authors thank the Lifestyle Validation Study staff (Kristie Antonitto, Kirstin Anderson, Stephanie Bostic, Lisa Bowser (deceased), Catherine Clowry, Stefanie Dean, Brenna Murphy, Maria Petkova and Sean Sinnott). Financial support: MLVS and WLVS are supported by National Institutes of Health (grants UM1 CA186107, UM1 CA176726, P01 CA055075-18S1, U01CA152904 and U01CA167552). K.L.I. was supported by a National Health and Medical Research Council fellowship. J.P. is supported by T32HL098048 from National Heart, Lung and Blood Institute. Conflict of interest: There are no conflicts of interest. Authorship: The authors’ responsibilities are as follows: K.L.I., J.P., Y.Y. and E.B.R. designed the analysis and had responsibility for the final content; E.B.R., W.C.W., L.S., K.L.I., J.P., S.A.S.-W. and S.R. collected data and performed computations; Y.Y., J.P. and K.L.I. analysed data and performed statistical analysis; Y.Y. and J.P. wrote the final manuscript; W.C.W., SSW, C.Y., S.A.S.-W., S.R., L.S., B.R. and A.C. provided conceptual advice and assisted in interpreting the data and editing the manuscript; all authors read and approved the manuscript. Ethical standards disclosure: This study was conducted according to the guidelines laid down in the Declaration of Helsinki, and all procedures involving research study participants were approved by the Harvard T.H. Chan School of Public Health and Brigham and Women’s Hospital. Written informed consent was obtained from all subjects.
Supplementary material
For supplementary material accompanying this paper visit https://doi.org/10.1017/S1368980020001627