


Malnutrition is usually measured by impairment in growth in weight and height(Reference de Onis, Blossner and Borghi1), but also refers to different nutritional status such as wasting/underweight, overweight, obesity, stunting/short stature and anaemia. These conditions during critical stages of life, such as infancy, childhood, reproductive age and pregnancy, are associated with significant functional impairment in adult life, reducing work capacity and decreasing economic productivity(Reference Delpeuch, Traissac and Martin-Prevel2–Reference Vella, Tomkins and Borghesi7). For these reasons, malnutrition is a major public health and development concern with important health and socio-economic consequences. The assessment of growth not only serves as one of the best global indicators of nutritional status, but also provides an indirect measurement of the quality of life of an entire population(Reference de Onis, Frongillo and Blossner8–Reference Salle, Chatelain and Nicolino10).
Socio-economic status and education level are the main social determinants of malnutrition. Social determinants of health are ‘the conditions in which people are born, grow, live, work and age, conditions that are mostly responsible for health inequities – the unfair and avoidable differences in health status seen within and between countries’(11).
Inequality in malnutrition refers to the degree to which childhood malnutrition rates differ between more and less socially, educationally and economically advantaged groups(Reference Van de Poel, Reza Hosseinpoor and Speybroeck12). Inequality and malnutrition constitute a vicious circle, which is difficult to leave without comprehensive strategies over all life-cycle stages.
Argentina is categorized as an upper-middle-income country by the World Bank and is identified as one of the largest economies in Latin America. The gross domestic product is more than $US 638 million; health and education areas account for 7 and 6 % of gross domestic product, respectively(13). The unique representative survey of health and nutrition of the maternal and child population was carried out in 2005 (ENNyS for its acronym in Spanish). At that moment, 60 % of households with children were below the poverty line and 35 % had unsatisfied basic needs(14).
The aim of the current analysis was to assess the prevalence of malnutrition by socio-economic wealth (SEW) and educational level (EL) among children and women of reproductive age in Argentina.
Methods
Our analysis used cross-sectional data from the ENNyS 2005. A probabilistic, multistage sample was selected, which involved the selection of localities, census blocks and three independent samples (children 6–23 months of age, children aged 2–5 years, women aged 11–49 years and pregnant women). The sample size consisted of 28 147 children aged <5 years representative at the provincial level and 6445 women of reproductive age representative at the regional level. Our analysis was performed excluding individuals without anthropometric, SEW and EL data (1132 children aged <5 years, ninety-seven adolescent girls aged 11–19 years and 218 women aged 20–49 years).
A general questionnaire collected information on household characteristics and goods, and sociodemographic characteristics of the householder and participant selected, according to age group. Anthropometric measurements (weight and length/height) and Hb determination were conducted for all participants in different age groups. All anthropometric dimensions were measured according to standardized techniques(14). Weight was measured using a portable scale (model CAM P-1001-P, precision of 100 g), with the participant without clothes or in light clothing and with correction for the weight of the clothes, according to standardized techniques(Reference Habicht15, 16). Body length (<4 years) and stature (≥4 years) were assessed using a stadiometer with a millimetre scale. Anthropometric indicators were assessed according to the WHO Growth Standards(Reference de Onis, Onyango and Borghi17–20). We defined overweight as BMI-for-age Z-score (BMIZ) > +2 and ≤+3 for children aged <5 years; BMIZ > +1 and ≤+2 for adolescent girls aged 11–19 years; and BMI ≥ 25 and <30 kg/m2 for women aged 20–49 years. Obesity was defined as BMIZ > +3 for children aged <5 years; BMIZ > +2 for adolescent girls aged 11–19 years; and BMI ≥ 30 kg/m2 for women aged 20–49 years. Wasting was defined as weight-for-height Z-score (WHZ) < −2 for children aged <5 years; underweight as BMIZ < −2 for adolescent girls aged 11–19 years; and BMI < 18·5 kg/m2 for women aged 20–49 years. Stunting was defined as height-for-age Z-score (HAZ) < −2 for children aged <5 years; HAZ < −2 for adolescent girls aged 11–19 years; and short stature as height < 1·49 m for women aged 20–49 years.
Hb was determined in venous blood by cyanomethaemoglobin in an automated counter. Anaemia was defined as Hb adjusted by altitude above sea level using the Cohen and Haas equation(Reference Cohen and Haas21) <11 mg/l for children aged <5 years; and <12 mg/l for women aged 11–49 years. The sample size for anaemia prevalence was 20 657 for children aged <5 years; 1480 for adolescent girls aged 11–19 years; and 5153 among women aged 20–49 years.
Individuals with BMIZ < −5 and >5, HAZ < −6 and >6, WHZ < −5 and >5, BMI < 10 and >58 kg/m2 and Hb < 4 and >18·5 mg/dl were excluded.
The category ‘freedom from malnutrition’ was defined as the absence of any condition (wasting/underweight, overweight, obesity, stunting/short stature and anaemia).
SEW was assessed using the methodology of the Comisión de Enlace Institucional(22) taking account of the proportion of contributors in the household, EL of the householder, employment status of the householder and medical coverage of the householder. Households were classified into three SEW levels according to defined cut-offs (low, medium, high). EL was classified as low (0–6 years), medium (7–12 years) or high (>12 years), counting years of formal education of the householder for children and adolescent girls aged <20 years and their own years of formal education for women aged 20–49 years.
The study was approved by the Ethics Committee of the Clínicas Hospital of the University of Buenos Aires. Information about the characteristics of the study was provided and participants were asked to sign informed consent before their inclusion in the study.
Statistical methods
Characteristics of the participants and households were described using means, proportions and 95 % CI for the overall sample and by SEW.
We estimated prevalence and 95 % CI of each form of malnutrition at the individual level, for all the population and for SEW and EL strata. Chi-square tests were conducted for testing differences in prevalence according to SEW and EL strata.
Analyses were conducted using the statistical software package IBM SPSS Statistics version 21 with appropriate weighting and adjustment for the sampling design.
Results
Sociodemographic characteristics are described in Table 1. Note that almost half of houses in Argentina did not have access to a public sanitary sewer system in 2005, including one-third of high-SEW households. Lack of access to a public network water was present in 30 % of low-SEW households, affecting them ten times more than in high SEW. A quarter of households had unsatisfied basic needs, a condition that affected 50·4 % in low SEW and 8·6 % in high SEW. One out of every five households received at least one food assistance, 43·8 % in low SEW and 8·1 % in high SEW.
Table 1 Sample characteristics, overall and by socio-economic wealth (SEW), in Argentina (data are from the Argentinian National Health and Nutrition Survey 2005 (ENNyS 2005))
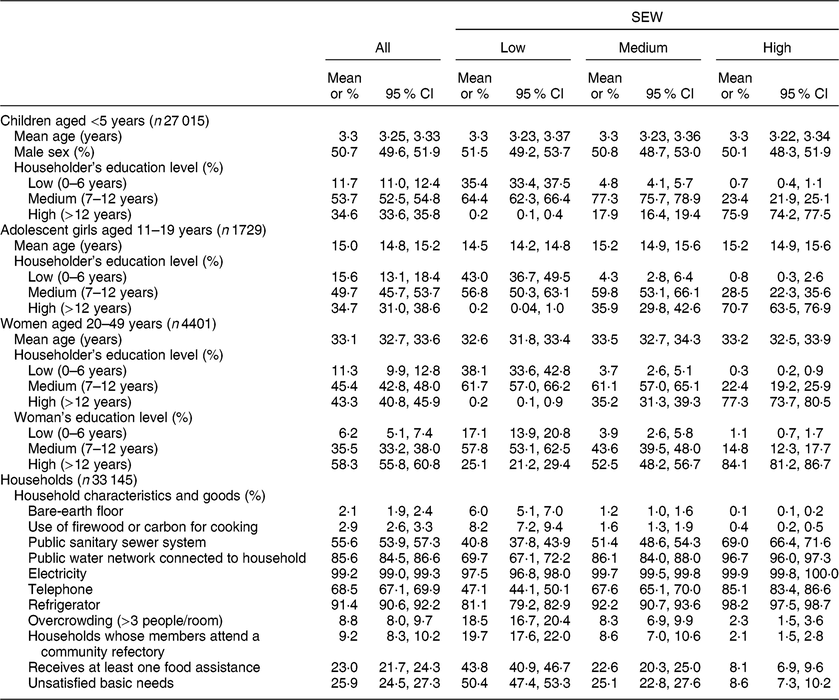
Household goods for all groups included variables available (not available: cell phone, television, motor vehicle, computer).
Looking at EL of the householder, more than 80 % of the population reached medium or high level, with a tendency to higher EL in women aged 20–49 years, remarkably in women with low SEW where 25·1 % reached high EL (Table 1).
Table 2 shows the distribution of malnutrition in each age group by SEW. In the present paper socio-economic status was not assessed as tertiles of income (as in other papers in this supplement) but as SEW levels, although the income distribution is quite balanced in each SEW level.
Table 2 Prevalence of malnutrition in all its forms, overall and by socio-economic wealth (SEW) and education level, among demographic groups in Argentina (data are from the Argentinian National Health and Nutrition Survey 2005 (ENNyS 2005))
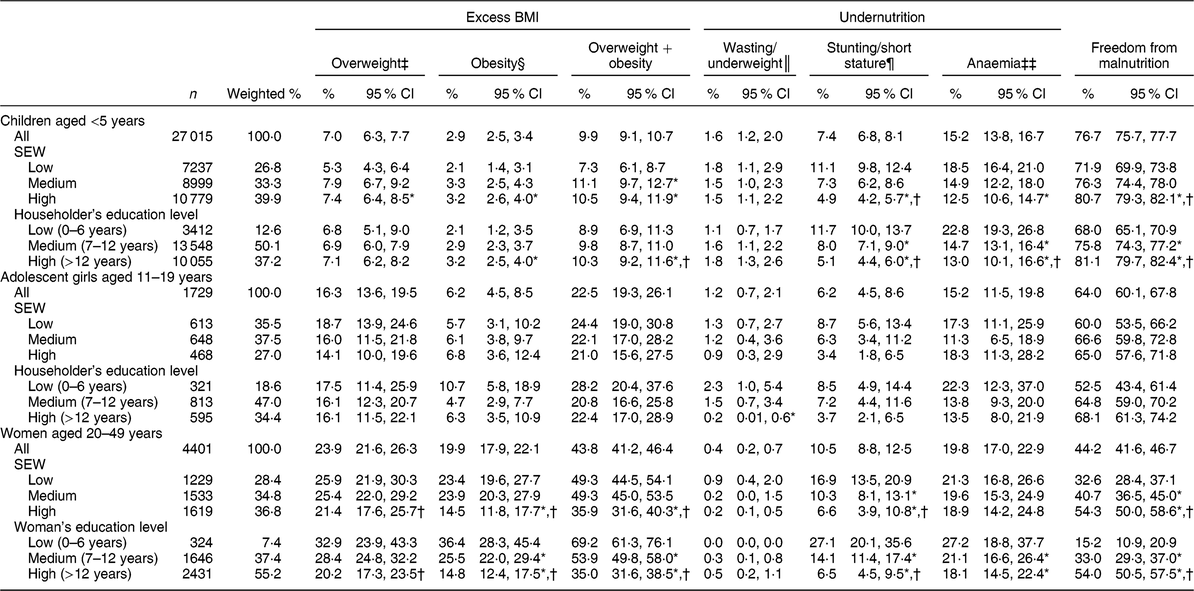
Prevalences and 95 % CI were calculated with weighting (fantrop and fbioq). The differences between groups were calculated using CROSSTAB chi-square, and customized tables in SPSS, without weighting.
* P < 0·05 v. low SEW/low education.
† P < 0·05 v. medium SEW/medium education.
‡ Overweight: BMI-for-age Z-score (BMIZ) > +2 and ≤+3 for children aged <5 years; BMIZ > +1 and ≤+2 for adolescent girls aged 11–19 years; and BMI ≥ 25 and <30 kg/m2 for women aged 20–49 years.
§ Obesity: BMIZ > +3 for children aged <5 years; BMIZ > +2 for adolescent girls aged 11–19 years; and BMI ≥ 30 kg/m2 for women aged 20–49 years.
║ Wasting: weight-for-height Z-score < −2 for children aged <5 years. Underweight: BMIZ < −2 for adolescent girls aged 11–19 years; and BMI < 18·5 kg/m2 for women aged 20–49 years.
¶ Stunting: height-for-age Z-score (HAZ) < −2 for children aged <5 years; HAZ < −2 for adolescent girls aged 11–19 years. Short stature: height < 1·49 m for women aged 20–49 years.
‡‡ Anaemia: Hb adjusted using the Cohen and Haas equation <110 g/l for children aged <5 years; and <120 g/l for women aged 11–49 years. The sample size for anaemia was 20 657 for children aged <5 years; 1480 for adolescent girls aged 11–19 years; and 5153 for women aged 20–49 years.
Overweight and obesity increased with age, whereas wasting/underweight decreased and stunting/short stature and anaemia had similar prevalence throughout the age groups (Fig. 1). The most prevalent condition of malnutrition was anaemia in children aged <5 years, anaemia and excess weight in adolescent girls and women. Looking at the healthier nutritional status, 77 % of children aged <5 years, 64 % of adolescent girls aged 11–19 years and 44 % of women aged 20–49 years showed freedom from malnutrition (Table 2).

Fig. 1 Prevalence of overweight and obesity and of stunting or short stature by (a) socio-economic wealth (SEW; ![]() , low;
, low; ![]() , medium;
, medium; ![]() , high) and (b) educational level (EL;
, high) and (b) educational level (EL; ![]() , low (<6 years);
, low (<6 years); ![]() , medium (7–12 years);
, medium (7–12 years); ![]() , high (>12 years)) among children aged <5 years (n 27 015), adolescent girls aged 11–19 years (n 1729) and women aged 20–29 years (n 4401) in Argentina. EL is based on years of education, counting years of formal education of the householder for children and adolescent girls, and counting their own years of formal education for women. *P < 0·05 v. low SEW/low EL; †P < 0·05 v. medium SEW/medium EL. (Data are from the Argentinian National Health and Nutrition Survey 2005 (ENNyS 2005))
, high (>12 years)) among children aged <5 years (n 27 015), adolescent girls aged 11–19 years (n 1729) and women aged 20–29 years (n 4401) in Argentina. EL is based on years of education, counting years of formal education of the householder for children and adolescent girls, and counting their own years of formal education for women. *P < 0·05 v. low SEW/low EL; †P < 0·05 v. medium SEW/medium EL. (Data are from the Argentinian National Health and Nutrition Survey 2005 (ENNyS 2005))
Overweight and obesity showed different tendency according SEW and EL in the analysed age groups; in children, these conditions increased with better SEW and EL. Wasting and underweight showed prevalence less than 2 %, without significance differences by SEW or EL. Stunting or short stature was higher in individuals with low SEW and EL, double the prevalence of those with high SEW and EL. This inequality reached a quadruple difference between low and high EL among women aged20–49 years (P < 0·05). Anaemia prevalence was inversely related to SEW and EL almost in all groups, except among adolescent girls where it reached high prevalence in low and high SEW groups.
Discussion
These data highlight that overweight and obesity were the main malnutrition problem in infancy and in women, followed by anaemia and stunting. The current analysis is part of a collaborative work that describes malnutrition in all its forms in several Latin American countries. Considering that the data are from 2005, malnutrition and socio-economic status could have changed since the information was captured. However, the ENNyS 2005 is the only national population survey available in Argentina to date and this kind of analysis has never been published before. Excess weight in children aged <5 years in Argentina was high in comparison to other countries of the region in the same period, such as Brazil, Guatemala and Chile(Reference Corvalan, Garmendia and Jones-Smith23, Reference Rivera, Pedraza and Martorell24).
In the current analysis, we found that women with low EL had quadruple the risk of stunting and double the risk for excess weight. They should be a main target group as there is strong evidence of the intergenerational effect of malnutrition and the risk that implies(Reference Martorell and Zongrone25). Children aged <5 years of low SEW or EL had double the risk of stunting. These results show strong inequalities in nutritional status according to socio-economic status and education.
In the first place, we consider it essential to reflect that the ENNyS was carried out after the economic, political and social crisis that affected Argentina since 2001, when 60·3 % of households with children were below the poverty line, reaching 77·2 % in the north-east region and 75·7 % in the north-west, and 35 % of households had unsatisfied basic needs(14).
From the end of the 20th century and especially during the first decades of the 21st, Argentina implemented different food policies, from food assistance to more complex policies and programmes with different modalities and criteria. Before 2000 these were mainly decentralized programmes focused to support the demand for food and the financing of vulnerable families. After the 2001 political and social crisis the National Food Security Plan and the National Nutrition and Food Program were created by National Law 25,724, with the purpose to cover the nutritional requirements of children aged ≤14 years, pregnant, disabled and older adults (>70 years) who lived below the poverty line established by the National Institute of Statistics and Census(26). This law was regulated in 2003 and included the prevention of specific nutritional deficiencies, breast-feeding and special attention to feeding during the first months of life, nutritional rehabilitation, food security, food quality and safety, nutritional education, food assistance, food self-production, the integral evaluation of the programme, and prevention in maternal and child health. These purposes were expected to be achieved through community refectories, development of family gardens, cash transfers, training and promotion of healthy environments, with the largest financial budget allocated to the food assistance component.
Although the National Food Security Plan provided the law mandate for a system for permanent monitoring of the nutritional status of the population, the only national nutrition survey to date is the ENNyS 2005.
Taking into account micronutrient deficiencies, Argentinian laws establish the fortification of whole milk powder (with iron, vitamin C and zinc) delivered by the national food programmes directed at children and pregnant women (Law 25,459) and wheat flour (with iron, folic acid, thiamin, riboflavin and niacin) to reduce anaemia and neural tube defects (Law 25,630).
There are two national universal health coverage programmes oriented to mothers and children: (i) the ‘Plan Materno Infantil’ that aims to reduce infant morbidity and mortality, improve child health and control growth; and (ii) the ‘Plan Sumar’ that focuses on providing health care to children, adolescents and pregnant women without health coverage. In 2009 the ‘Asignación Universal por hijo’ and in 2011 ‘Asignación Universal por Embarazo’ were created, both are transfers of money conditional on health control and school assistance.
To date public policies of health and nutrition show a high degree of segmentation and have focused on wasting/underweight, but have not addressed overweight and obesity. The high rates of excess weight and anaemia, the moderate prevalence of stunting and the low frequency of wasting/underweight are a call to rethink public health policies considering the scenario described in the present paper and taking into account that these data are at least a decade out of date.
The differences in excess weight by SEW and EL between age groups show the need for strategies according to stage of life and the social and economic situation. On the other hand, the similar prevalence of stunting in all age groups proves that there is a structural and old problem in Argentina, requiring integral solutions and approaches.
In the present analysis we considered the cut-off points of BMIZ suggested by the WHO; it is important to clarify that Argentina’s norms establish different cut-off points to categorize overweight and obesity, and the results could differ from other analyses(Reference Abeyá Gilardon, Calvo and Durán27, 14).
Another issue we want to bring to discussion refers to the consideration of ethnic disparities in health. According to the National Census of population and households of 2010, there are 955 032 indigenous people or descendants of indigenous peoples in Argentina (2·4 % of the total population, reaching 8 % in north and south provinces such as Jujuy, Rio Negro and Neuquén)(28). ENNyS 2005 did not include rural populations with fewer than 5000 residents, so there is no national information on the anthropometric and nutritional situation of indigenous peoples. A recent analysis of 89 617 children younger than 6 years old in Salta Province showed that stunting and wasting are asymmetrically distributed, affecting mainly indigenous peoples, while overweight and obesity have a greater impact on non-indigenous children. The larger gap was found for stunting, with prevalence as high as 18 % among indigenous children from the east-south zone, which is 9·5 times greater than the prevalence for the Creole children of the Calchaqui valleys (1·9 %)(Reference Soruco, Piselli, Chauqui and Soruco29). The concentration of malnutrition in indigenous regions calls to an equity issue that we must account for in the design of social, health and food policies with cultural pertinence. The first step is to have national information about the nutritional and health status of these population groups.
Finally, we consider that the first ENNyS was very important to provide a baseline of the nutritional and health status of the maternal and child population. More than a decade after, Argentina is running the second ENNyS that will allow us to know the impact of the public health and nutrition policies implemented to date.
Conclusion
These findings indicate the need for policies and programmes that consider the actual scenario and social inequalities to tackle the different forms of malnutrition throughout each stage of the life cycle.
The challenge ahead is to increase efforts to maintain healthy growth, prevent linear growth failure and anaemia, and pay special attention to the obesity and non-communicable diseases epidemic. If we ponder the social determinants of nutrition and health(Reference Marmot30), we must take into account:
1. the role of nutrition-sensitive policies and programmes and the need to apply the Health in all Policies Strategy(31) in the fight against malnutrition in all its forms;
2. the call to face up to the challenge of social justice, amplifying our commitment to policies that reach all socially controllable factors of health(Reference Daniels32); and
3. no longer focus solely on the provision of food and health assistance and prevention, but take ethical and distributive considerations on board. This could involve the need for cooperative and interdependent relationship schemes in policy design that underpin justice obligations towards all members of our society.
Acknowledgements
Acknowledgements: The authors would like to thank to Alicia Rovirosa for her help in interpreting the results, CESNI by supporting the time for the realization of this work, and the Latin American Nutrition Leadership Program (Programa LILANUT) for coordination of the publication. Financial support: DSM Nutritional Products provided funds for the publication of this manuscript. DSM Nutritional Products had no role in the design, analysis or writing of this article. Conflict of interest: The authors declare that there are no conflicts of interest. Authorship: M.E.Z., A.I.S. and E.C. designed the research. M.E.Z. and A.I.S. analysed the data and drafted the paper with contributions from E.C. All the authors read and approved the final manuscript. Ethics of human subject participation: This study was conducted according to the guidelines laid down in the Declaration of Helsinki and the CIOMS International Ethical Guidelines for Health-related Research Involving Humans (Council for International Organizations of Medical Sciences; 2016). All procedures were approved by Ethics Committee of the Clínicas Hospital of the University of Buenos Aires. All participants were asked to sign informed consent before to their inclusion in the study.


