


Childhood and adolescent obesity has presented a growing prevalence over the last three decades( Reference Ng, Fleming and Robinson 1 ). Over the same period, modifications to how foods are produced and increasing availability of transportation facilities have been observed, characterizing an ‘obesogenic’ environment( Reference Popkin 2 ) with increasing prevalence of non-healthy eating habits( Reference Popkin 3 ) and decreasing prevalence of physical activity( Reference Owen, Sparling and Healy 4 ). The dietary profile of populations within this scenario has become characterized by high energy density, in which foods rich in fibre have been replaced by products rich in fat and sugars, with a high level of processing( Reference Popkin 3 , Reference Martins, Levy and Claro 5 ).
A recent food classification (NOVA) based on the extent and purpose of industrial food processing has divided foods into four groups: unprocessed or minimally processed foods; processed culinary ingredients; processed foods; and ultra-processed foods. This last category comprises a group of industrial formulations that are manufactured using several ingredients and a series of processes( Reference Monteiro, Cannon and Moubarac 6 – Reference Monteiro, Levy and Claro 9 ). Most of these products contain little or no whole food. They are ready-to-consume or ready-to-heat and thus require little or no culinary preparation, which makes them easily accessible and convenient. Typically, they are combined with sophisticated use of additives, to make them durable and hyper-palatable. However, they have very low nutritional quality and their consumption tends to limit consumption of unprocessed or minimally processed foods( Reference Monteiro, Cannon and Moubarac 6 – Reference Monteiro, Levy and Claro 9 ).
Consumption of ultra-processed foods has been pointed out as a risk factor for increasing obesity, as measured by BMI, among both adolescents and adults( Reference Louzada, Baraldi and Steele 10 , Reference Mendonça, Pimenta and Gea 11 ). Moreover, it has been shown in the literature that individuals who are obese at an early age tend to remain obese throughout life( Reference Singh, Mulder and Twisk 12 ). Considering the growing prevalence of obesity and the consumption of ultra-processed foods worldwide, the objective of the present systematic review was to identify papers on the association between consumption of ultra-processed food and body fat during childhood and adolescence.
Methods
Search strategy
The search was performed in two worldwide electronic databases (PubMed and Web of Science) and in a Latin American and Caribbean database (LILACS). Terms relating to body composition and to consumption of ultra-processed foods were used. The search key was composed of combinations of the following terms: (‘body composition’ OR ‘fat free mass’ OR ‘fat mass’ OR ‘dual-energy X-ray absorptiometry’ OR ‘bioelectrical impedance’ OR ‘plethysmography’ OR ‘DEXA scan’ OR ‘DXA scan’ OR ‘body fat’ OR ‘bodpod’ OR ‘lean mass’ OR ‘adiposity’) AND (‘ultra processed’ OR ‘ultraprocessed’ OR ‘ultra-processed’ OR ‘ready-to-eat’ OR ‘ready-to-consume’ OR ‘industrialized’ OR ‘fast-food’ OR ‘fast food’ OR ‘fastfood’ OR ‘junk food’ OR ‘prepared food’ OR ‘candy’ OR ‘ice cream’ OR ‘chocolate’ OR ‘carbonated beverage’ OR ‘soft drink’ OR ‘sweetened beverage’ OR ‘snacks’ OR ‘sausage’ OR ‘hot dog’ OR ‘burger’ OR ‘dietary patterns’ OR ‘dietary behaviors’ OR ‘dietary habits’). There were no restrictions to the search regarding topic. All papers needed to be original studies conducted on human subjects. The search was last updated on 15 July 2016.
In addition to the electronic search, the reviewers also undertook a hand search in the reference list of each study included, to identify potentially relevant studies that had not been reached in the initial search.
Eligibility criteria
To be eligible, the studies had to fulfil the following criteria. They needed to: evaluate the association between consumption of ultra-processed food and body fat; evaluate the exposure (consumption of ultra-processed food) and the outcome (body fat) during childhood or adolescence; and not solely include individuals with specific diseases or health conditions.
The exposure variable was the intake of any ultra-processed food, as defined in the NOVA classification (see online supplementary material, Supplemental Table 1)( Reference Monteiro, Cannon and Moubarac 6 – Reference Monteiro, Levy and Claro 9 ). Studies that evaluated only BMI as the outcome were not included because BMI does not discriminate between fat mass and fat-free mass.
Selection of the studies
Two independent reviewers conducted an initial selection of the articles located in the electronic search, by means of reading the titles and abstracts. The papers selected at this stage were then read in full and were evaluated in accordance with the eligibility criteria. A third reviewer adjudicated regarding whether articles should be kept or excluded in situations in which the two reviewers disagreed.
Data analysis
From the full analysis on the articles thus selected, the following data were extracted: country and publication year; study design; sample size; age group evaluated; methods and instruments used to measure the exposure and outcome variables; variables used to control for confounding and in the mediation analysis (when present); and main findings.
The general and methodological quality of observational studies was evaluated in accordance with the STROBE (Strengthening the Reporting of Observational Studies in Epidemiology) Statement( Reference Vandenbroucke, Von Elm and Altman 13 ). The CONSORT (Consolidated Standards of Reporting Trials) Statement( Reference Moher, Hopewell and Schulz 14 ) was used to evaluate intervention studies. The maximum scores that can be attained is 22 points in the STROBE assessment and 25 points in CONSORT; of which 9 and 10 points, respectively, related to the Methods section of the studies.
Results
The electronic search resulted in 2243 titles (Fig. 1). After removing duplicates, 1553 titles/abstracts remained to be analysed. From reading the titles and abstracts, and in accordance with the eligibility criteria, Reviewer 1 and Reviewer 2 excluded 1498 and 1519 articles, respectively. After full readings of the articles, Reviewer 1 excluded another twenty-eight articles and Reviewer 2, nineteen, of which nine were coincident. The reasons for exclusion of the articles were that they presented:
-
∙ Investigation of ultra-processed food consumption and body fat, but not the association between these two variables (n 17);
-
∙ Investigation of food consumption by means of scores or dietary indices, from which it was not possible to discriminate the consumption of ultra-processed foods (n 5);
-
∙ Evaluation of food consumption according to dietary patterns or by means of specific questionnaires such as the ‘Block’ questionnaire, which asks not only about ultra-processed foods, but also about other food groups, such as unprocessed or minimally processed foods (n 4);
-
∙ Food consumption based on their components (macronutrients, sugar and energy density; n 4);
-
∙ No evaluation of the outcome or the exposure of interest (n 2);
-
∙ Use of behavioural clusters, including consumption of fruits and vegetables, consumption of soft drinks, sedentary behaviour and physically active behaviour (n 1);
-
∙ Evaluation of the frequency with which adolescents had meals in fast-food restaurants, without evaluation of the foods consumed (n 1);
-
∙ Evaluation of Indigenous populations (n 1);
-
∙ Evaluation of fast-food consumption without discriminating which foods belong to this group (n 1);
-
∙ Evaluation of consumption of sugar that is not considered ultra-processed in the NOVA classification (n 1);
-
∙ Evaluation of an intervention composed of changes to physical activity, concomitant to consumption of ready-to-eat cereals, which hindered evaluation of the specific effect of ready-to-eat cereals (n 1).
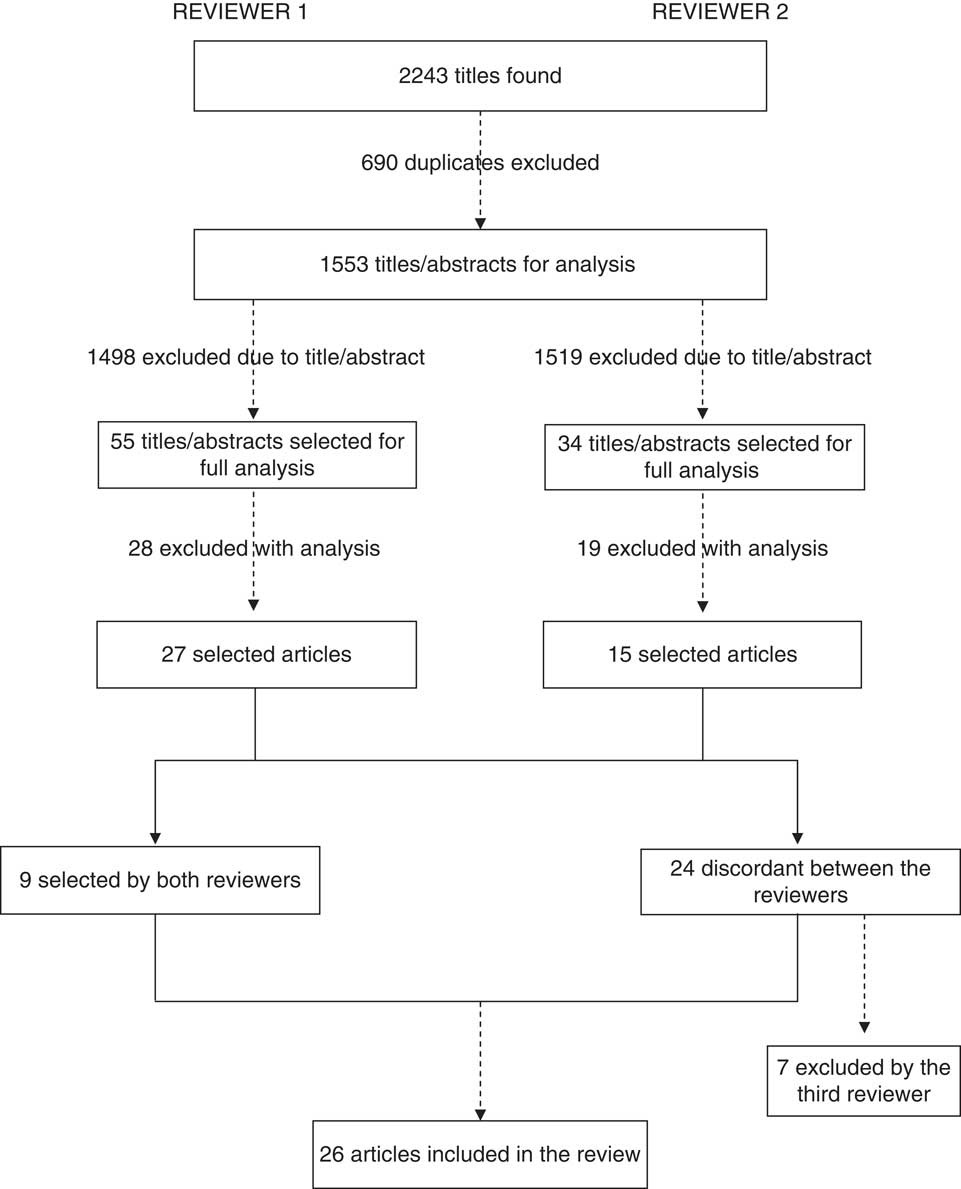
Fig. 1 Flowchart of article selection for the present systematic literature review on consumption of ultra-processed foods and body fat during childhood and adolescence
After full readings of the articles, the two reviewers agreed regarding selection of nine studies and disagreed regarding twenty-four. The third reviewer judged the relevance of the twenty-four articles on which the two previous reviewers had disagreed and decided to exclude seven of them. The reasons for the seven exclusions at this stage were that they presented:
-
∙ Investigation of ultra-processed food consumption and body fat, but not the association between these two variables (n 4);
-
∙ Evaluation of food consumption according to dietary patterns or by means of specific questionnaires such as the ‘Block’ questionnaire, which asks not only about ultra-processed foods, but also about other food groups, such as unprocessed or minimally processed foods (n 2);
-
∙ Body fat analysed as the ratio of two skinfolds (subscapular to triceps skinfold), which only evaluates the fat distribution, and not the quantity of fat (n 1).
No other papers were located through the hand search in the reference lists of the articles selected. A total of twenty-six studies were retained for the current review.
Among these twenty-six selected articles, twelve evaluated the association between consumption specifically of soft drinks or sweetened beverages and body fat( Reference Johnson, Mander and Jones 15 – Reference Zheng, Allman‐Farinelli and Heitmann 26 ), eleven explored the association between groups of ultra-processed foods and body fat( Reference Phillips, Bandini and Naumova 27 – Reference Leary, Lawlor and Smith 37 ) and three evaluated the association between consumption of specific ultra-processed foods (sweets, chocolate and ready-to-eat cereals) and body fat( Reference Chaves, Franceschini Sdo and Ribeiro 38 – Reference Michels, De Henauw and Breidenassel 40 ).
Seven studies were conducted in the USA( Reference Fiorito, Marini and Francis 19 , Reference Bauer, Neumark-Sztainer and Fulkerson 21 , Reference Laska, Murray and Lytle 22 , Reference Phillips, Bandini and Naumova 27 – Reference Wosje, Khoury and Claytor 29 , Reference Montoye, Pfeiffer and Alaimo 33 ), four in the UK( Reference Johnson, Mander and Jones 15 , Reference Bigornia, LaValley and Noel 24 , Reference Laverty, Magee and Monteiro 25 , Reference Leary, Lawlor and Smith 37 ), three in Germany( Reference Libuda, Alexy and Sichert-Hellert 18 , Reference Alexy, Libuda and Mersmann 30 , Reference Diethelm, Günther and Schulze 35 ), two in New Zealand( Reference Duncan, Schofield and Duncan 17 , Reference Howe, Black and Wong 32 ) and one each in Australia( Reference Zheng, Allman‐Farinelli and Heitmann 26 ), South Africa( Reference Feeley, Musenge and Pettifor 31 ), Canada( Reference Shang, O’Loughlin and Tremblay 36 ), Netherlands( Reference Yildirim, Singh and Velde 34 ), Mexico( Reference Denova-Gutiérrez, Jiménez-Aguilar and Halley-Castillo 16 ), Spain( Reference Gómez-Martínez, Martín and Romeo 20 ) and Brazil( Reference Chaves, Franceschini Sdo and Ribeiro 38 ). Three were multicentre studies: one was carried out in four Oceania countries (New Zealand, Australia, Fiji and Tonga)( Reference Sluyter, Scragg and Plank 23 ); and the other two were conducted in ten European cities in nine different countries (Austria, Belgium, France, Germany, Greece, Hungary, Italy, Spain and Sweden)( Reference Cuenca-García, Ruiz and Ortega 39 , Reference Michels, De Henauw and Breidenassel 40 ). The articles selected were published between 2004 and 2015.
Most of the studies were cohorts (n 15)( Reference Johnson, Mander and Jones 15 , Reference Denova-Gutiérrez, Jiménez-Aguilar and Halley-Castillo 16 , Reference Libuda, Alexy and Sichert-Hellert 18 , Reference Fiorito, Marini and Francis 19 , Reference Laska, Murray and Lytle 22 , Reference Bigornia, LaValley and Noel 24 , Reference Laverty, Magee and Monteiro 25 , Reference Phillips, Bandini and Naumova 27 – Reference Feeley, Musenge and Pettifor 31 , Reference Diethelm, Günther and Schulze 35 – Reference Leary, Lawlor and Smith 37 ), although two of these only presented cross-sectional analyses( Reference Denova-Gutiérrez, Jiménez-Aguilar and Halley-Castillo 16 , Reference Shang, O’Loughlin and Tremblay 36 ); followed by cross-sectional studies (n 6)( Reference Duncan, Schofield and Duncan 17 , Reference Gómez-Martínez, Martín and Romeo 20 , Reference Howe, Black and Wong 32 , Reference Chaves, Franceschini Sdo and Ribeiro 38 – Reference Michels, De Henauw and Breidenassel 40 ); and intervention studies (n 5)( Reference Bauer, Neumark-Sztainer and Fulkerson 21 , Reference Sluyter, Scragg and Plank 23 , Reference Zheng, Allman‐Farinelli and Heitmann 26 , Reference Montoye, Pfeiffer and Alaimo 33 , Reference Yildirim, Singh and Velde 34 ), among which three only presented cross-sectional analyses( Reference Bauer, Neumark-Sztainer and Fulkerson 21 , Reference Sluyter, Scragg and Plank 23 , Reference Montoye, Pfeiffer and Alaimo 33 ) (Table 1). In four studies, only girls were evaluated( Reference Fiorito, Marini and Francis 19 , Reference Bauer, Neumark-Sztainer and Fulkerson 21 , Reference Phillips, Bandini and Naumova 27 , Reference Ritchie, Spector and Stevens 28 ). The sample size ranged from 120 to 13170 individuals. Twelve studies had sample sizes larger than 1000 individuals( Reference Denova-Gutiérrez, Jiménez-Aguilar and Halley-Castillo 16 , Reference Duncan, Schofield and Duncan 17 , Reference Gómez-Martínez, Martín and Romeo 20 , Reference Sluyter, Scragg and Plank 23 – Reference Laverty, Magee and Monteiro 25 , Reference Ritchie, Spector and Stevens 28 , Reference Feeley, Musenge and Pettifor 31 , Reference Yildirim, Singh and Velde 34 , Reference Leary, Lawlor and Smith 37 , Reference Cuenca-García, Ruiz and Ortega 39 , Reference Michels, De Henauw and Breidenassel 40 ) (Table 1).
Table 1 Description of the main characteristics observed in the studies selected for the present systematic literature review on consumption of ultra-processed foods and body fat during childhood and adolescence (n 26)
DXA, dual-energy X-ray absorptiometry; BIA, bioelectrical impedance analysis.
* Dietary patterns, snacks, fast foods, junk foods and convenience foods.
† Chocolate, sweets and ready-to-consume breakfast cereals.
‡ Recall period: annual (n 2), weekly (n 2) and no available information (n 4).
Regarding the age of the samples studied, in the longitudinal studies (cohort and intervention studies) the mean age at which the exposure was evaluated ranged from 7·8 (sd 3·6) to 8·49 (sd 4·0) years, and the mean age at which the outcome was assessed ranged from 13·5 (sd 3·3) to 14·1 (sd 3·6) years. In the studies with cross-sectional analysis, the mean age ranged from 11·2 (sd 3·3) to 15·8 (sd 3·0) years.
Food consumption was investigated using four different types of instrument. Eight studies used FFQ( Reference Denova-Gutiérrez, Jiménez-Aguilar and Halley-Castillo 16 , Reference Duncan, Schofield and Duncan 17 , Reference Phillips, Bandini and Naumova 27 , Reference Feeley, Musenge and Pettifor 31 , Reference Howe, Black and Wong 32 , Reference Leary, Lawlor and Smith 37 , Reference Chaves, Franceschini Sdo and Ribeiro 38 , Reference Michels, De Henauw and Breidenassel 40 ); seven used food records (referring to three days: two weekdays and one day at the weekend)( Reference Johnson, Mander and Jones 15 , Reference Libuda, Alexy and Sichert-Hellert 18 , Reference Bigornia, LaValley and Noel 24 , Reference Ritchie, Spector and Stevens 28 – Reference Alexy, Libuda and Mersmann 30 , Reference Diethelm, Günther and Schulze 35 ); six applied 24 h recalls( Reference Fiorito, Marini and Francis 19 , Reference Gómez-Martínez, Martín and Romeo 20 , Reference Laska, Murray and Lytle 22 , Reference Zheng, Allman‐Farinelli and Heitmann 26 , Reference Shang, O’Loughlin and Tremblay 36 , Reference Cuenca-García, Ruiz and Ortega 39 ); and five asked questions about the consumption of specific foods( Reference Bauer, Neumark-Sztainer and Fulkerson 21 , Reference Sluyter, Scragg and Plank 23 , Reference Laverty, Magee and Monteiro 25 , Reference Montoye, Pfeiffer and Alaimo 33 , Reference Yildirim, Singh and Velde 34 ) with varying recall periods (last month, last week, last 5 d or the day before the interview; Table 1).
Except for the studies that evaluated the consumption of specific ultra-processed foods (n 15)( Reference Johnson, Mander and Jones 15 – Reference Zheng, Allman‐Farinelli and Heitmann 26 , Reference Chaves, Franceschini Sdo and Ribeiro 38 – Reference Michels, De Henauw and Breidenassel 40 ), the analysis on food consumption in the remaining studies was performed by means of dietary patterns (n 6)( Reference Ritchie, Spector and Stevens 28 , Reference Wosje, Khoury and Claytor 29 , Reference Howe, Black and Wong 32 , Reference Diethelm, Günther and Schulze 35 – Reference Leary, Lawlor and Smith 37 ); or according to groups of specific foods (n 5) such as energy-dense snacks (soft drinks, sweets, crisps, bakery products and ice cream; n 2)( Reference Phillips, Bandini and Naumova 27 , Reference Yildirim, Singh and Velde 34 ), or through investigation of fast foods, bakery foods and soft drinks (n 1)( Reference Feeley, Musenge and Pettifor 31 ), junk foods (sweetened beverages, French fries and crisps, frozen/baked desserts and chocolate sweets; n 1)( Reference Montoye, Pfeiffer and Alaimo 33 ) or convenience foods (pre-baked frozen products, canned or instantaneous products such as salads or soups, or ready-to-eat meals, like pizzas, except fast foods; n 1)( Reference Alexy, Libuda and Mersmann 30 ).
In the studies that evaluated dietary patterns, the ultra-processed groups included snacks (like crisps or chocolates), sweets, convenience foods and fast foods( Reference Ritchie, Spector and Stevens 28 ); snacks and convenience foods( Reference Diethelm, Günther and Schulze 35 ); fast foods (sweetened beverages, French fries, fried chicken, salted snacks, hamburgers, hotdogs and pizzas)( Reference Shang, O’Loughlin and Tremblay 36 ); artificially sweetened beverages and manufactured sauces and butters( Reference Wosje, Khoury and Claytor 29 ); bakery products, carbonated beverages, sweets, crisps, sausages, hamburgers, pizzas, cookies, instant noodles, ready-to-eat meals and aromatized milk( Reference Leary, Lawlor and Smith 37 ); and sweets, bakery products, crisps and natural or artificially sweetened beverages( Reference Howe, Black and Wong 32 ).
Three methods for evaluating body fat were used. Ten studies obtained body fat measurements by means of bioelectrical impedance analysis (BIA)( Reference Duncan, Schofield and Duncan 17 , Reference Laska, Murray and Lytle 22 , Reference Sluyter, Scragg and Plank 23 , Reference Laverty, Magee and Monteiro 25 – Reference Phillips, Bandini and Naumova 27 , Reference Howe, Black and Wong 32 , Reference Montoye, Pfeiffer and Alaimo 33 , Reference Chaves, Franceschini Sdo and Ribeiro 38 , Reference Cuenca-García, Ruiz and Ortega 39 ); followed by nine through dual-energy X-ray absorptiometry (DXA)( Reference Johnson, Mander and Jones 15 , Reference Denova-Gutiérrez, Jiménez-Aguilar and Halley-Castillo 16 , Reference Fiorito, Marini and Francis 19 , Reference Bauer, Neumark-Sztainer and Fulkerson 21 , Reference Bigornia, LaValley and Noel 24 , Reference Wosje, Khoury and Claytor 29 , Reference Feeley, Musenge and Pettifor 31 , Reference Shang, O’Loughlin and Tremblay 36 , Reference Leary, Lawlor and Smith 37 ); and seven from skinfolds( Reference Libuda, Alexy and Sichert-Hellert 18 , Reference Gómez-Martínez, Martín and Romeo 20 , Reference Ritchie, Spector and Stevens 28 , Reference Alexy, Libuda and Mersmann 30 , Reference Yildirim, Singh and Velde 34 , Reference Diethelm, Günther and Schulze 35 , Reference Michels, De Henauw and Breidenassel 40 ) (Table 1). Body fat was analysed as a percentage in sixteen articles( Reference Denova-Gutiérrez, Jiménez-Aguilar and Halley-Castillo 16 – Reference Laska, Murray and Lytle 22 , Reference Laverty, Magee and Monteiro 25 – Reference Ritchie, Spector and Stevens 28 , Reference Alexy, Libuda and Mersmann 30 , Reference Montoye, Pfeiffer and Alaimo 33 , Reference Shang, O’Loughlin and Tremblay 36 , Reference Chaves, Franceschini Sdo and Ribeiro 38 , Reference Michels, De Henauw and Breidenassel 40 ) and in kilograms in four( Reference Bigornia, LaValley and Noel 24 , Reference Wosje, Khoury and Claytor 29 , Reference Feeley, Musenge and Pettifor 31 , Reference Leary, Lawlor and Smith 37 ), while another three studies presented body fat both in kilograms and as a fat mass index (FMI)( Reference Johnson, Mander and Jones 15 , Reference Howe, Black and Wong 32 , Reference Diethelm, Günther and Schulze 35 ) and two, as both a percentage and in kilograms( Reference Sluyter, Scragg and Plank 23 , Reference Cuenca-García, Ruiz and Ortega 39 ). One study used the sum of the triceps, biceps, suprailiac and subscapular skinfolds (in millimetres) as a proxy for the body fat component( Reference Yildirim, Singh and Velde 34 ).
Regarding study quality, the mean totals were 17·1 and 18·0 points, respectively, for the observational studies (n 24) and intervention studies (n 2)( Reference Zheng, Allman‐Farinelli and Heitmann 26 , Reference Yildirim, Singh and Velde 34 ). The mean score reached in the Methods section was 7 points for studies evaluated using both the STROBE Statement and the CONSORT Statement.
Among the studies that evaluated the association between consumption of groups of ultra-processed foods and body fat (n 11)( Reference Phillips, Bandini and Naumova 27 – Reference Leary, Lawlor and Smith 37 ), six found associations( Reference Wosje, Khoury and Claytor 29 – Reference Feeley, Musenge and Pettifor 31 , Reference Diethelm, Günther and Schulze 35 – Reference Leary, Lawlor and Smith 37 ), which were all in a positive direction (i.e. higher consumption of ultra-processed foods was related to higher levels of body fat). All the studies that showed this association had a longitudinal design (cohort; Table 2).
Table 2 Summary of the selected studies that investigated the association between consumption of groups of ultra-processed foods and body fat in children and adolescents
BF%, body fat percentage; BIA, bioelectrical impedance analysis; BF, body fat; DXA, dual-energy X-ray absorptiometry; FMI, fat mass index; TV, television; P75, 75th percentile; P25, 25th percentile.
Among the studies that evaluated the association between consumption of soft drinks/sweetened beverages and body fat (n 12)( Reference Johnson, Mander and Jones 15 – Reference Zheng, Allman‐Farinelli and Heitmann 26 ), eight found associations( Reference Denova-Gutiérrez, Jiménez-Aguilar and Halley-Castillo 16 , Reference Duncan, Schofield and Duncan 17 , Reference Fiorito, Marini and Francis 19 , Reference Laska, Murray and Lytle 22 – Reference Zheng, Allman‐Farinelli and Heitmann 26 ), which were all in a positive direction (i.e. higher consumption of soft drinks/sweetened beverages was followed by higher levels of body fat; Table 3). Laska et al. ( Reference Laska, Murray and Lytle 22 ) found an association with a positive direction only in relation to consumption of sweetened beverages among boys, in a longitudinal analysis, and of diet soda among girls, in a cross-sectional analysis. However, the result for girls may have reflected reverse causality bias, given that those with excess body fat might have reported higher consumption of diet products because of their condition (Table 3). The studies that showed this association mostly had a longitudinal design (cohort or intervention; Table 3).
Table 3 Summary of the selected studies that investigated the association between soft drink/sweetened beverages consumption and body fat in children and adolescents
BF, body fat; DXA, dual-energy X-ray absorptiometry; FMI, fat mass index; BF%, body fat percentage; BIA, bioelectrical impedance analysis; TV, television; EER, estimated energy requirement; ECHO, Etiology of Childhood Obesity; IDEA, Identifying Determinants of Eating and Activity; SEIFA, Socio-Economic Index for Areas; TBFM, total body fat mass.
Among the studies that evaluated the association between consumption of other ultra-processed foods (sweets( Reference Chaves, Franceschini Sdo and Ribeiro 38 ), chocolate( Reference Cuenca-García, Ruiz and Ortega 39 ) and ready-to-eat cereals( Reference Michels, De Henauw and Breidenassel 40 )) and body fat, two found associations with a negative direction (i.e. increased consumption of chocolate( Reference Cuenca-García, Ruiz and Ortega 39 ) and ready-to-eat cereals( Reference Michels, De Henauw and Breidenassel 40 ) was associated with a lower percentage of body fat; Table 4).
Table 4 Summary of the selected studies that investigated the association between the consumption of specific ultra-processed foods and body fat
BF%, body fat percentage; BF, body fat; BIA, bioelectrical impedance analysis.
The main variables used in the adjusted analyses were total energy intake, residual energy intake (energy intake from sources other than the foods evaluated), physical activity, age, sex, skin colour/ethnicity, parents’ education and BMI, age at the menarche or at sexual maturation, birth weight and breast-feeding. In the present review, divergent opinions were observed regarding use of total energy intake as a possible confounding factor. Out of the twenty-six studies, nine adjusted for total energy intake( Reference Johnson, Mander and Jones 15 , Reference Denova-Gutiérrez, Jiménez-Aguilar and Halley-Castillo 16 , Reference Fiorito, Marini and Francis 19 , Reference Laska, Murray and Lytle 22 , Reference Zheng, Allman‐Farinelli and Heitmann 26 , Reference Wosje, Khoury and Claytor 29 , Reference Shang, O’Loughlin and Tremblay 36 , Reference Leary, Lawlor and Smith 37 , Reference Cuenca-García, Ruiz and Ortega 39 ) and five adjusted for residual energy intake( Reference Libuda, Alexy and Sichert-Hellert 18 , Reference Bigornia, LaValley and Noel 24 , Reference Laverty, Magee and Monteiro 25 , Reference Phillips, Bandini and Naumova 27 , Reference Alexy, Libuda and Mersmann 30 ). None of the studies investigated whether total energy intake mediated the effect of consumption of ultra-processed foods or soft drinks on body fat. Two articles did not present adjusted analysis( Reference Gómez-Martínez, Martín and Romeo 20 , Reference Chaves, Franceschini Sdo and Ribeiro 38 ) and the remaining studies adjusted for variables other than energy intake.
Discussion
In summary, the present review showed that most of the studies that investigated consumption of groups of ultra-processed foods, as well as most of the studies that evaluated consumption of soft drinks/sweetened beverages, found positive associations with body fat. The lack of association in some of the studies may have been due to methodological issues. First, body fat was measured using three different methods (DXA, BIA and skinfolds). Among the studies that found associations, half used DXA( Reference Denova-Gutiérrez, Jiménez-Aguilar and Halley-Castillo 16 , Reference Fiorito, Marini and Francis 19 , Reference Bigornia, LaValley and Noel 24 , Reference Wosje, Khoury and Claytor 29 , Reference Feeley, Musenge and Pettifor 31 , Reference Shang, O’Loughlin and Tremblay 36 , Reference Leary, Lawlor and Smith 37 ), and among those that did not find any association, only two used this equipment( Reference Johnson, Mander and Jones 15 , Reference Bauer, Neumark-Sztainer and Fulkerson 21 ). Although the DXA method evaluates body composition indirectly, it has the capacity to derive measurements of greater validity than is possible using doubly indirect methods such as BIA and skinfolds.
Second, the instruments for the food consumption evaluation also varied among the studies (FFQ, food record, 24 h recall and specific questions). Although all these instruments generate information about consumption of certain groups of ultra-processed foods or about a specific ultra-processed food, a great variety of products were included, which could at least partly explain the divergence among the findings. For example, dietary patterns vary according to sex, socio-economic level, ethnic group and culture, such that specific dietary patterns are derived for each specific population( Reference Hu 41 ). This impairs the comparability of findings between studies( Reference Hu 41 ). Six of the studies analysed here derived dietary patterns( Reference Ritchie, Spector and Stevens 28 , Reference Wosje, Khoury and Claytor 29 , Reference Howe, Black and Wong 32 , Reference Diethelm, Günther and Schulze 35 – Reference Leary, Lawlor and Smith 37 ).
Among the studies that evaluated other specific ultra-processed foods, two of them found associations in a negative direction, such that they showed that higher consumption of chocolate and ready-to-eat cereals was related to a lower percentage of body fat. These findings may reflect residual confounding. Michels et al. ( Reference Michels, De Henauw and Breidenassel 40 ) did not adjust for consumption of milk (that was added to ready-to-eat cereals) or for physical activity, although these variables might have a correlation with body fat. Cuenca-García et al. ( Reference Cuenca-García, Ruiz and Ortega 39 ) evaluated chocolate consumption from a 24 h recall, an instrument that does not measure dietary habits. Additionally, because of the cross-sectional design of the study by Cuenca-García et al. ( Reference Cuenca-García, Ruiz and Ortega 39 ), it is possible that individuals with lower percentages of body fat had higher consumption of chocolate only over the 24 h preceding the interview.
It is important to emphasize that only one of the studies selected for the present review reported the parameters that were used for sample size calculation( Reference Chaves, Franceschini Sdo and Ribeiro 38 ) and none presented a statistical power calculation. Nevertheless, the scores relating to study quality, as evaluated through the STROBE and CONSORT Statements, were considered good. There was no difference in the mean scores for quality between studies that did or did not find an association (data not shown).
Although ultra-processed foods are a major source of energy intake, they are just one group of foods among all the possible sources of energy intake in the diet. Therefore, to assess the effect of the energy provided by ultra-processed foods on body fat levels, it is important to disentangle the effect of ultra-processed foods from the effect of other sources of energy. Consequently, studies that adjusted for total energy intake (including energy provided by ultra-processed foods) may in fact have over-adjusted for the exposure, thus decreasing the magnitude of the association between consumption of ultra-processed foods and body fat. For this reason, we take the view that the adjustment should be limited to residual energy solely from other sources. Nevertheless, seven of the nine studies examined here that adjusted for total energy intake found positive associations( Reference Denova-Gutiérrez, Jiménez-Aguilar and Halley-Castillo 16 , Reference Fiorito, Marini and Francis 19 , Reference Laska, Murray and Lytle 22 , Reference Zheng, Allman‐Farinelli and Heitmann 26 , Reference Wosje, Khoury and Claytor 29 , Reference Shang, O’Loughlin and Tremblay 36 , Reference Leary, Lawlor and Smith 37 ).
Regarding the strategies used by the authors of the studies selected for the current analysis to decrease the occurrence of bias, self-reporting errors were considered in five studies( Reference Johnson, Mander and Jones 15 , Reference Denova-Gutiérrez, Jiménez-Aguilar and Halley-Castillo 16 , Reference Libuda, Alexy and Sichert-Hellert 18 , Reference Bigornia, LaValley and Noel 24 , Reference Zheng, Allman‐Farinelli and Heitmann 26 ). One study evaluated under-reporting and over-reporting of energy intake (daily intakes <79 % and >121 % of the estimated energy requirement, respectively). However, they did not exclude these cases from the analysis, under the argument that in doing so, the children who were of greatest interest for the study (those with highest percentages of body fat) would probably be excluded( Reference Johnson, Mander and Jones 15 ). Therefore, the implausible reports were used as a covariate in the adjusted analysis. Individuals with implausible energy intake (under-reported or over-reported) were excluded in two studies( Reference Phillips, Bandini and Naumova 27 , Reference Montoye, Pfeiffer and Alaimo 33 ). Cuenca-García et al. ( Reference Cuenca-García, Ruiz and Ortega 39 ) performed additional analyses in which obese adolescents were excluded, to prevent underestimated reporting of chocolate intake. However, after these analyses, the results did not change. Some of the studies reported using standardized protocols for anthropometric measurements( Reference Denova-Gutiérrez, Jiménez-Aguilar and Halley-Castillo 16 , Reference Sluyter, Scragg and Plank 23 , Reference Laverty, Magee and Monteiro 25 , Reference Ritchie, Spector and Stevens 28 , Reference Howe, Black and Wong 32 , Reference Yildirim, Singh and Velde 34 – Reference Shang, O’Loughlin and Tremblay 36 ), to decrease occurrences of measurement errors.
Among the limitations of the present review, the great variability of methods used to investigate food consumption can be highlighted, along with the great variability of the instruments used to assess body composition. These factors hindered evaluation of the data by means of meta-analysis. The articles included in the review looked only at specific products and did not apply the NOVA classification. In fact, so far, only two studies have applied the NOVA classification to assess associations: not with body fat but with obesity and weight gain. Louzada et al.( Reference Louzada, Baraldi and Steele 10 ) were the first to use this indicator in a cross-sectional study to evaluate the association with obesity. Mendonça et al.( Reference Mendonça, Pimenta and Gea 11 ) applied this indicator in the first cohort study that was planned to evaluate the effect of ultra-processed food consumption on weight gain.
On the other hand, to the best of our knowledge, the present systematic review is the first addressing the association between consumption of ultra-processed foods and body fat levels among children and adolescents. Investigations on consumption of ultra-processed foods during childhood have gained importance because the dietary habits acquired over this period tend to be kept throughout life, which can influence the prevalence of obesity in this population( Reference Madruga, Araújo and Bertoldi 42 , Reference Ventura and Worobey 43 ).
Conclusion
It is evident that the great majority of the literature on the association between consumption of ultra-processed foods and body fat levels presents positive directions (i.e. increased consumption ends up increasing body fat levels). Most of the studies with designs of greater robustness, and which used DXA to evaluate body composition, showed positive associations between consumption of ultra-processed foods and body fat levels.
Despite the large number of studies on the association between dietary habits and body fat levels that are available in the literature, there is a lack of studies exploring the association between consumption of ultra-processed foods and obesity among children and adolescents. Use of a standardized food classification, such as NOVA, which makes it possible to consider the level of food processing, is much needed to uncover the role of such foods in obesity epidemics and to enable comparability between the findings of upcoming studies.
Acknowledgements
Acknowledgements: The authors thank the National Support Program for Centers of Excellence (PRONEX-CAPES) and Brazilian National Research Council (CNPq). Financial support: This research received no specific grant from any funding agency in the public, commercial or not-for-profit sectors. Conflict of interest: None. Authorship: All authors contributed substantially to the conception and design, data acquisition, analysis and/or interpretation. C.S.C. drafted the article and B.D.-P., M.C.F.A. and I.S.S. reviewed it critically for important intellectual content. All authors approved the final version to be published. Ethics of human subject participation: Not applicable.
Supplementary Material
To view supplementary material for this article, please visit https://doi.org/10.1017/S1368980017001331


