


It is widely accepted that diversity is one of the key elements of a healthy diet. Much research has focused on quantitative or frequency methods to assess diet quality but these methods are often time-consuming, complex and costly. In developing countries, especially in African rural areas, such dietary studies are particularly difficult to carry out because people generally eat from a shared bowl, making the measurement of individual dietary consumption very difficultReference Hudson1. Moreover, due to the generally low level of education, it is almost impossible to use certain types of questionnaires, such as diet diaries or other methods, which require the subjects to record their own food consumption; it is also difficult to estimate serving sizes. In such contexts it thus seems more appropriate to assess food consumption through qualitative dietary recall, which is simpler, faster and cheaper than quantitative or frequency methods. A method that has been used more and more frequently in recent years is the evaluation of dietary quality using simple tools such as diversity scores, i.e. the number of food groups consumed over a reference period. These scores are promising measurement tools: several studies have shown that they are good proxies of overall dietary quality both in industrialised and developing countriesReference Brown, Peerson, Kimmons, Hotz, Black and Michaelsen2–Reference Ogle, Hung and Tuyet6, and, in addition, that they are positively associated with the nutritional status of young childrenReference Arimond and Ruel7–Reference Leroy, Habicht, Ruel, Simler and Dittoh10. Recently, we found that a simple dietary diversity score was linked to the nutritional status of adult women in rural Burkina FasoReference Savy, Martin-Prevel, Sawadogo, Kameli and Delpeuch11. Finally, results of several studies also suggest that dietary diversity could be a useful indicator of household food securityReference Hoddinott and Yohannes12.
However, despite growing interest in these scores, many questions about their construction and application remain unanswered. For example, the length of the recall period required to accurately assess the usual consumption of an individual remains unclear. Some authors believe that a short dietary recall (over a 24-hour period) is a reliable method to assess food intake in developing countriesReference Dop, Milan and N'Diaye13–Reference Swindale and Bilinsky16 since in these settings diets tend to be simple and monotonous, and intra-individual variation is consequently usually lowReference Beaton, Milner, Corey, McGuire, Cousins and Stewart17. Furthermore, the short recall period considerably minimises memory bias which often occurs especially when the level of education is lowReference Swindale and Ohri-Vachaspati18. On the other hand, some authors claim that a 24-hour recall may result in underestimation of the consumption of some foods eaten less routinelyReference Palaniappan, Cue, Payette and Gray-Donald19, Reference Nyambose, Koski and Tucker20. Moreover, the question whether atypical days should be included or not in the recall period also needs to be clarified as we know that food consumption can change on these special days, both in industrialisedReference Craig, Kristal, Cheney and Shattuck21 and developing countriesReference Swindale and Ohri-Vachaspati18. Atypical days are exceptional days such as feasts, marriages or funerals. In industrialised countries, atypical days also include weekend days, which are classically accounted for in food survey designs. In rural areas in developing countries, weekend days do not have any special significance, and so less attention is generally paid to atypical days.
The aim of the present paper is to compare dietary diversity score calculated over a 1-day recall period (1d-DDS) with that of a 3-day recall period (3d-DDS), as well as their relationships with the socio-economic characteristics and nutritional status of respondents. Furthermore, this paper highlights some practical aspects of the collection of dietary data for use in dietary diversity scores in an underprivileged context in Africa. The study took place in a rural area in Burkina Faso and concerned women of childbearing age.
Methods
Study area
The study was conducted in a rural area located in north-east Burkina Faso (Gnagna Province). This province covers an area of 8640 km2 and has about 350 000 inhabitants. The majority of the population belongs to the Gourmantche ethnic group. The main economic activity is agriculture, mainly cereal production, and cattle breeding. Gnagna Province is a particularly vulnerable area characterised by a landlocked position, harsh climatic conditions with scarce and erratic rainfall, and low-quality soils.
Sampling
A cross-sectional domestic survey was carried out from March to April 2003 in 30 villages in the province. The sample stemmed from a previous survey carried out in March 2002Reference Savy, Martin-Prevel, Sawadogo, Kameli and Delpeuch11, for which a two-stage sampling technique was used based on the most recent available population census (1998): first, the 30 villages were randomly selected with a probability proportional to size; then six compounds were randomly selected in each village. In 2002, the survey included a final sample of 691 women living in the selected compounds, all of whom had at least one child under 5 years old. In 2003, a new survey was carried out among the same women but the final sample included only 550 of them because of death, removal or refusal to take part. All women included in the study, as well as the village, compound and household heads, verbally gave their free and informed consent to participate.
Food consumption
A simple questionnaire allowed all types of foods consumed during each of the three previous days to be noted. Each woman involved in the study was asked to recall all the communal dishes she had eaten in the compound during this period. From a practical point of view, we first let the woman spontaneously describe her food consumption and then we prompted her to be sure that no meal had been forgotten. Next the detailed list of all the ingredients of the dishes mentioned was collected from the woman in charge of their preparation. We also took into account all other foods consumed by each woman inside or outside the compound (meals, snacks, etc.). The exact composition of all these foods was also noted.
The information collected on dietary consumption allowed us to calculate a dietary diversity score (DDS), defined as the number of different food groups consumed by each woman over a given reference period. Since there is no internationally acknowledged recommendation about the food group classification to be used, we decided to use a classification based on nine food groups derived from a proposal made at a workshop on dietary diversity in Rome in October 200422: cereals/roots/tubers; pulses/nuts; vitamin-A-rich fruits/vegetables; other vegetables; other fruits; meat/poultry/fish; eggs; milk/dairy products; oils/fats. Neither the frequency of consumption nor the amount of food consumed was taken into consideration. The scores were used as discrete quantitative variables and were also analysed after categorisation into tertiles (Fig. 1). Since the qualitative recall was conducted over three distinguishable days, the DDS could be calculated over a 1-day period (Day-1, Day-2 and Day-3), over 2 days (Day-1+Day-2) and over 3 days (Day-1+Day-2+Day-3). The recall was randomly made on weekdays or on weekend days, since weekends do not have any special significance in the context of our study. We took care to not include atypical days (local feasts or celebrations) in the recall. However, when there had been a market day in the village during the recall period, these ‘market days’ were noted and taken into account in the analysis because food consumption was likely to be different on that occasion.

Fig. 1 Distribution of dietary diversity score (DDS) and cut-offs for the tertiles
Anthropometric measurements
The women were weighed to the nearest 100 g on electronic scales with a weighing capacity of 10 to 140 kg. Their height was measured to the nearest 1 mm with locally made portable devices equipped with height gauges (SECA 206 Bodymeter). Body mass index (BMI), calculated as weight/height2 (kg m− 2), was used to assess the women's body fat.
Skinfold thickness (biceps, triceps, subscapular and suprailiac) was measured to the nearest 0.2 mm according to standard proceduresReference Lohman, Roche and Martorell23 with a Holtain calliper. The measurement of skinfold thickness enabled us to determine body density (BD) by applying the equation developed by Durnin and WomersleyReference Durnin and Womersley24. We took the higher lean mass density in black subjects into account to calculate the body fat percentage (BFP) from BD by adapting the equation of SiriReference Siri25 according to the recommendation of HeyvardReference Heyward26.
Women who said they were pregnant (n = 94) and women with unreliable anthropometric measurements due to physical handicap or other causes (n = 9) were excluded from all analyses involving anthropometrics. On the other hand, lactating women and women who had recently delivered were included in the study because they represent a high proportion of the sample in such a context. In any case, the impact of including these women on anthropometrics was considered to be low.
Other information
Sociodemographic, economic and sanitary information was collected at the scale of the household or the individual. The following indices were computed in order to summarise information:
• ‘Property level’ index, which reflected the economic level of the household. This index was constructed using a correspondence analysis performed on a matrix of indicator variables that code housing quality (walls, roof, floor), possessions (electric lamp, petrol lamp, radio, bicycle, moped) and ownership of cattle. For a given household, the value on the first principal component of the correspondence analysis gives a coordinate that is interpreted as a summary indicator of its economic level. This index was then divided into tertilesReference Traissac, Delpeuch, Maire, Martin-Prével, Cornu and Trèche27.
• ‘Hygiene’ index, which provided information about hygiene practices and conditions in the household. It was constructed from information concerning the type of water and the distance to the water source, latrines, proximity to animals, garbage disposal and spot-check of the cleanliness of the compound. Based on this index, the sample was divided into three classes: ‘high’, ‘medium’ and ‘low’ hygienic conditions.
• ‘Care for women’ index, which assessed the level of attention and support given to women by the other members of the household. This index was constructed from the following information: knowledge and use of family planning, obstetrical background (history of stillbirth or infant death), level of prenatal care (number of visits, malaria prophylaxis, iron supplementation), beneficial practices during pregnancy (improved feeding, alleviation of physical burden, postpartum rest time), declared ill treatment, power of decision and autonomy. The index was subsequently divided into tertiles.
Two carefully trained fieldworkers (one male and one female) with at least a secondary-school education conducted the interviews. Both of them spoke French and local languages (Gourmantchema, Moore and Fulfulde). The anthropometric measurements were carried out in a standardised way by the same surveyors, using procedures recommended by the World Health Organization28.
Data management and statistical analysis
The data were entered with EpiData software, version 3.1Reference Lauritsen, Bruus and Myatt29. Data quality was ensured by a check file associated with the data entry process, double entry and also by further data cleaning. Data management, including computation of DDS from the dietary recall and recipe databases, was performed with SAS System® version 8.030.
The first step was to examine the effect on DDS of several factors related to the dietary recall methodology: length of the recall period, day of the recall, effect of market days. The effect of these factors was assessed using a general linear model with DDS as the response variable. The factors which were found to influence the dietary scores were then called ‘recall factors’ and taken into account in subsequent analyses.
The second step was to study the relationship between DDS and sociodemographic and economic variables and the relationship between DDS and anthropometric indices. These comparisons were adjusted for the ‘recall factors’ and we then compared the results for the 1d-DDS calculated at Day-1 with those for the 3d-DDS. Finally, as suggested by RuelReference Ruel31, these comparisons were adjusted for potential confounders identified among the sociodemographic and economic variables. Details on the method of selection of these variables are given elsewhereReference Savy, Martin-Prevel, Sawadogo, Kameli and Delpeuch11. The general linear model was used for the analyses in which the dependent variable was quantitative and the logistic model was used when it was categorical.
All analyses were performed taking into account the effect of the study design with appropriate procedures (PROC MIXED with the ‘RANDOM’ instruction and PROC GENMOD with the ‘REPEATED’ instruction in the SAS System® software30).
Results
Characteristics of the sample
The average age of the women of the sample was 29 years, and the majority (85%) belonged to the Gourmantche ethnic group. The majority belonged to households where polygamy existed and 80% had no education. As for nutritional status, mean BMI was not exceptionally low (21.0 ± 2.3 kg m− 2), but nevertheless it was well below the threshold of 23 kg m− 2 which is likely to provide benefits to adults in developing countries32. Eleven per cent of the women were underweight (BMI < 18.5 kg m− 2). According to the body fat ranges for standard adults reported by Gallagher et al.Reference Gallagher, Heymsfield, Heo, Jebb, Murgatroyd and Sakamoto33, the mean BFP was rather low (23.1 ± 3.9%) (Table 1).
Table 1 Characteristics of the women of the sample
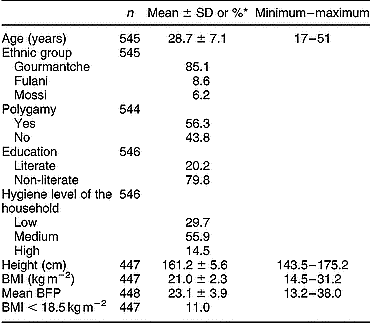
BMI – body mass index; BFP – body fat percentage.
* Mean ± standard deviation for continuous variables and percentage for categorical variables.
Influence of the recall factors on dietary diversity scores
Market days
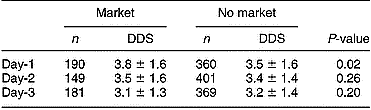
Table 2 presents the mean 1d-DDS calculated at Day-1, Day-2 and Day-3 as a function of ‘market days’. Generally speaking, the mean DDS was higher when there was a market day than when there was none. At Day-1, the DDS was 3.8 when there was a market versus 3.5 when there was none (P = 0.02). However, the effect of market days on food consumption was not significant at Day-2 and Day-3.
Table 2 Dietary diversity score (DDS) on market versus non-market days
In order to clarify the effect of market day on DDS, we examined the changes in the type of food consumed when there had been a market day the day before the survey (using 1-day recall data for Day-1) (Fig. 2). More women ate vegetables (other than vitamin-A-rich vegetables; 53.7% vs. 38.1%, P = 0.0005), especially gombo, tomato, onion and cabbage, and also meat and fish (70.5% vs. 58.6%, P = 0.005). Other foods or food groups were also consumed by more women when there was a market day, but the differences were not statistically significant: legumes (35.8% vs. 28.1%, P = 0.06), rice (33.7% vs. 27.8%, P = 0.1) and fats/oils (40.0% vs. 34.2%, P = 0.2).

Fig. 2 Percentage of women who consumed food from given food groups on market versus non-market days (Day-1)
Recall period
Figure 3 shows the DDS calculated over 1-day, 2-day and 3-day recall periods. The DDS were adjusted for ‘market days’, which were shown to influence food consumption. The dietary scores ranged from 2 to 7 for all these periods. As expected, the DDS increased with the length of the recall period. However, it is worth noting that the increase was much higher between 1 day and 2 days of recall (+0.7 food groups; F = 9.9; P < 0.0001) than between 2 and 3 days (+0.2 food groups; F = 5.1; P < 0.0001). The differences in DDS observed between 1-day and 3-day recall concerned certain food groups in particular, i.e. vegetables (other than vitamin-A-rich vegetables) which were consumed by 71.8% of the women over 3 days and by only 43.5% over 1 day (P < 0.0001), fats/oils group (56.6% vs. 36.2%, P < 0.0001) and legumes (48.7% vs. 30.7%, P < 0.0001). To a lesser extent, it also concerned the group of vitamin-A-rich vegetables (98.9% vs. 86.5%, P < 0.0001) and the group of meat and fish (71.8% vs. 62.7%, P < 0.0001) (Fig. 4).

Fig. 3 Dietary diversity score (DDS) as a function of the length of the recall period. Note: all analyses were adjusted for market days

Fig. 4 Percentage of women who consumed food from given food groups over the 1-day and 3-day periods
Day of recall
We then compared the mean 1d-DDS calculated at Day-1, Day-2 and Day-3, adjusted for ‘market days’. The longer the time between the recall day and the day of the interview, the lower the DDS (mean DDS: 3.5 at Day-1, 3.3 at Day-2 and 3.1 at Day-3, i.e. a decrease of 0.4 food groups between Day-1 and Day-3, P < 0.0001). The food groups which were less frequently declared by the women at Day-2 and Day-3 compared with Day-1 were fats/oils (36.2% at Day-1 vs. 31.8% at Day-2 vs. 23.7% at Day-3), vegetables (43.5% vs. 41.1% vs. 31.4%) and legumes (30.7% vs. 24.6% vs. 19.9%) (detailed results not shown).
Relationships between dietary diversity scores and sociodemographic and economic characteristics
We then compared links between socio-economic characteristics of the women and the 1d-DDS at Day-1 or the 3d-DDS. The results are presented in Table 3. Both types of DDS were linked to sociodemographic and economic variables. The women had higher DDS when the indicator of property level of their household was higher. Other economic factors also influenced the dietary scores: the women's DDS was higher when the head of the household had a secondary activity versus none (+0.4 for 1 day and 3 days) or when the household owned some agricultural tools versus none (+0.2, P = 0.05 for 1 day and +0.4, P = 0.002 for 3 days). Moreover, the dietary scores were also better when the hygiene index of the household was higher. Clearly, the level of ‘care for women’ positively influenced their dietary scores (for 1 day, the mean DDS was 3.2 for the low level of care vs. 3.8 for the high level P = 0.0009; for 3 days, the corresponding figures were 4.1 vs. 4.7, P = 0.0005). There was also a significant difference in dietary scores between ethnic groups: the Fulani group generally had lower scores. On the other hand, the women's education was not linked with their DDS and the same result was observed for the level of education of the household head (result not shown).
Table 3 Dietary diversity scores as a function of some sociodemographic and economic variables, after adjustment for market days

1d-DDS – dietary diversity score calculated over a 1-day period; 3d-DDS – dietary diversity score calculated over a 3-day period; HH – head of household.
Generally speaking, the relationships observed between the sociodemographic and economic variables and the DDS remained the same whether scores were calculated over a 1-day or a 3-day period.
Relationships between dietary diversity scores and anthropometric indices
We then analysed the relationships between dietary scores split into tertiles and the women's nutritional status. Table 4 presents the results of the raw relationships (adjusted only for ‘market days’) and of the relationships additionally adjusted for potential confounders. The nutritional status of the women, as reflected by all anthropometric indices, was significantly associated with their tertile of 1d-DDS calculated at Day-1. Indeed, the mean BMI of the women differed by 1.1 kg m− 2 between the high and low categories of DDS. This corresponds to a weight difference of nearly 1.5 kg for a woman of average height (1.61 m in this population). As a consequence, the percentage of underweight women changed from 3.5% in the high category of DDS to 17.7% in the low category. The mean BFP increased by 1.8% between the low and high categories of the 1d-DDS. For 3d-DDS tertiles, the anthropometric indices were also better in the high category of DDS than in the low category (respectively, 7.0% vs. 17.4% of underweight women). The mean BFP increased by 1.0% between the low and high categories of the 3d-DDS. After adjustment for potential confounders, the relationships between the 1d-DDS in tertiles and anthropometrics persisted. On the other hand, adjustment for potential confounders weakened the relationships between tertiles of the 3d-DDS and anthropometric indices, and these links were no longer statistically significant.
Table 4 Anthropometric indices of the women according to dietary diversity scores in tertiles, raw and adjusted for sociodemographic and economic variables

BMI – body mass index; OR – odds ratio; CI – confidence interval; BFP – body fat percentage; 1d-DDS – dietary diversity score calculated over a 1-day period; 3d-DDS – dietary diversity score calculated over a 3-day period.
* Only adjusted for market days.
† Adjusted for market days, age, education and ethnic group of the woman, secondary activity of the household head, hygiene index of the household and index of care for women.
Discussion
Owing to the fact that quantitative food surveys are difficult to conduct, particularly in developing countries, there is a growing interest in the use of simple tools, such as dietary diversity scores derived from qualitative recalls, to assess the diet quality of individuals. Nevertheless, as stressed by RuelReference Ruel31, these tools still raise some methodological questions. Our study clarified some points, such as the importance of taking into account atypical days in the recall period. In developing countries, market days are very important for people from a social standpoint and our study showed that they had a real influence on the women's dietary diversity. Indeed, we showed that more women consumed vegetables (other than vitamin-A-rich vegetables), meat/fish and legumes. In fact, rice dishes with peanut, tomato or vegetable sauces are very common in markets. Furthermore, meat and fish are often added to these dishes or consumed as snacks (meat on a skewer or fried fish). To our knowledge, no previous study has demonstrated the importance of taking into account market days in the design and/or analysis of food surveys in such contexts.
Apart from these differences in food consumption due to market days, we also observed some variations in food consumption between the 1-day and the 3-day periods, which raises the question of the reference period during which the dietary information should be collected. To date, the scientific community has not succeeded in defining the number of recall days required to correctly reflect individual food consumption. Despite low day-to-day variability of the diet in the study area, a single day of recall seems insufficient to capture the main diversity of the women's diets, since we observed a marked increase in DDS with an increase in the number of recall days. In fact, the food groups vegetables, fats/oils and legumes, which are rich in micronutrients or energy, were not often captured by the 1-day recall. On the other hand, over 3 days, it seems that almost the entire food repertory of the women was covered since the DDS reached or almost reached a plateau over this period; the fact that markets generally follow a 3-day cycle in Gnagna Province certainly contributes to reaching this saturation point. Thus, increasing the number of recall days beyond 3 days would probably not be useful in this specific context. However, we question the reliability of the 3-day recall because we showed that the women of the sample declared fewer foods at Day-2 and Day-3 than at Day-1, particularly for the groups fats/oils, vegetables and legumes. Since the inter-day variability is very low in the study context and because of the constant decrease in DDS with increase in the length of time between the day to be recalled and the day of the interview, we assume that this was due to memory bias. Women probably had more difficulty remembering all the foods they consumed two or three days before the day of the interview. Indeed the fact that market days have an influence on DDS only at Day-1 also highlights the memory problem. Women may also have become tired of answering a long questionnaire and may therefore not have given appropriate answers for Day-2 and Day-3. The problems of faulty recall have already been reported in developing countries and have led to recommendations to conduct dietary recall over short periodsReference Swindale and Ohri-Vachaspati18. Other authors also mentioned the effects of training or conditioning when the recall is made over several days, which would lead to bias for subsequent reporting days compared with the first dayReference Pao, Mickle and Burk34. The use of a pre-established food list rather than spontaneous responses might have helped the women to recall what they ate over the previous three days. However, in the context of our study, we believe that such a method could influence the responses of the subjects and thus lead to over-declaration of the food intakes. Moreover, the complexity of the intra-household food distribution in Gnagna Province obliged us to deal first with the recall of dishes and/or snacks and then with the ingredients, rather than directly with the food items.
Irrespective of the number of recall days and whether adjusted for market days during the recall period or not, our study showed that scores of dietary diversity were strongly linked to the socio-economic characteristics of the women and their households. This type of link has been demonstrated beforeReference Hatloy, Hallund, Diarra and Oshaug8, Reference Savy, Martin-Prevel, Sawadogo, Kameli and Delpeuch11 and our study confirms that food diversity scores can be useful indicators of the socio-economic level of households. Furthermore, we showed that the nutritional status of the women was better when their DDS was higher, whether it was calculated over a 1-day or a 3-day period. In an underprivileged rural area, it can be assumed that dietary diversity reflects the overall quality of the dietReference Allen, Black, Backstrand, Pelto, Ely and Molina35; it is consequently not surprising that the DDS was linked to the nutritional status of women since higher scores correspond to a more frequent consumption of energy-rich foodsReference Savy, Martin-Prevel, Sawadogo, Kameli and Delpeuch11. Nevertheless, the relationship between DDS and the nutritional status of women would not necessarily be identical in urban areas. Indeed, in higher-income contexts a higher DDS is often linked to overweight or obesityReference Kennedy36.
The links observed between anthropometrics and the 1d-DDS were statistically more significant than with the 3d-DDS. This may be partly due to unbalanced tertiles for the 3d-DDS (Fig. 1). Unfortunately, there is no international consensus on the cut-offs for the number of food groups to determine a ‘high’, ‘medium’ and ‘low’ diet quality. Consequently, the limits of the DDS categories are usually based on the distribution of the score and this often leads to unbalanced tertiles when the number of food groups is low. Also, in the literature, the number of food groups varies considerably from one study to another since no international recommendation exists at this time. These problems of food group classifications have already been raised by researchers who work on diversity scoresReference Swindale and Bilinsky16, Reference Ruel31, Reference Arimond and Ruel37. However, it can also be assumed that the two scores do not reflect exactly the same characteristics of the diet. The 1d-DDS clearly distinguished women who had very basic diets from those who had better diets; this score therefore seems to capture the ‘poverty’ of the diet in an instantaneous way since the assessment was based on a 1-day period. On the other hand, over a 3-day period, the women were more likely to reach a more satisfactory diversity score. Thus, the increase in the number of recall days tends to group together women with only approximately identical dietary patterns, which could explain the less marked relationships observed between the 3d-DDS and nutritional status of the women.
Finally, we can conclude that the choice of a 1d-DDS or 3d-DDS depends on the objectives of the study. Both scores can be used to assess the socio-economic status of the household. To predict the nutritional status in a given population, a simple recall conducted over a 1-day period seems to be sufficient and in addition has the advantage of being rapid, reliable and less expensive. This method can be very useful for monitoring nutritional outcomes or for targeting interventions, but only at the population level because a 1-day recall cannot measure the usual consumption of an individual. To achieve the latter objective, a recall conducted over several non-consecutive days including a special day would be more appropriate, as is recommended for industrialised countriesReference Willett38. In our context, the special day would be a market day. However, conducting the recall over several days is complex and is therefore less easy to implement to developing countries. Of course, whatever the method chosen, a good knowledge of the area under study is needed in order to adapt data collection to the specific context.
Acknowledgements
The authors thank the two fieldworkers and the population of Gnagna Province for their welcome and their collaboration which allowed successful data collection.
The first author received a research allowance from the French Ministry of Research through the Doctoral School 393 of Pierre and Marie Curie University (Paris VI).
The study was funded by the Institut de Recherche pour le Développement (IRD).


