


Introduction
Data is increasingly vital to products and services across the digital economy. Some are digitally native, such as social media, whose content is largely provided by its users and whose algorithms are subsequently shaped by their behaviors. Others embed computation into a variety of traditional physical products such as cars, smart doorbells, and smart watches, linking to each other in an Internet of Things around which services can be built. The widespread use of data in products and services raises important questions about the opportunities that data brings to the process of designing products and services, including how it enables co-design by diverse stakeholders, as well as its challenges, especially privacy, ownership, and transparency.
We explore the opportunities and challenges of data-informed design within a distinctive context, that of museums and galleries. Like many organizations within the cultural and creative industries, and indeed the even wider experience economy, museums and galleries have been turning to data to inform the design of customer experiences, that is, visiting experiences. Not only are museums and galleries turning to data to help understand their visitors’ behaviors and preferences but, enabled through the likes of social media, they are also increasingly harnessing data to deliver digitally interactive experiences and engage visitors in acts of co-design and co-creation. Driven by the post-colonial and feminist perspectives that underpin the “new museology” (Vergo, Reference Vergo1989), many museums and galleries are shifting from long-held paternalistic traditions to new methods of collecting data and representing diverse voices that can challenge the status quo. While this approach encourages each visitor to, for example, make and share their own interpretations, it also leaves museums and galleries to struggle with the concomitant challenges of who gets to see and own those interpretations, particularly those narratives that conflict with other interpretations (including, potentially, the museum's own). Thus, the data being collected or disseminated by these institutions has inherent complexities and contradictions that have serious ramifications on personal, cultural, and even political levels – think of the deeply personal stories in the collections of Holocaust museums, or the international strife over ownership of national treasures such as the “Elgin Marbles” (UK name) or “Parthenon Marbles” (Greek name). The experiences we examine in this paper were designed and delivered not long before the beginning of the global COVID-19 pandemic (early 2020), but our writing process has been very much informed by the ways in which, in our estimation, both the challenges and the opportunities are likely to intensify in the future.
We report the results of a 3-year Research Through Design (RTD) process (Zimmerman et al., Reference Zimmerman, Forlizzi and Evenson2007) in which we partnered with museums and galleries to design, deploy, and study data-driven visitor experiences. RTD is a practice-led approach in which design knowledge emerges through reflecting on practical experience. We, therefore, reflect across our portfolio of designs (Gaver, Reference Gaver2012) to draw out common themes and concepts. This took place under an umbrella project called GIFT that sought to combine the physical and digital elements of museum experiences into new forms of visitor experience (Løvlie et al., Reference Løvlie, Benford, Spence and Waern2019). The experiences in our portfolio are diverse, including two examples of “superimposed reality” in which virtual models are overlaid on physical sets; a smartphone app that guides visitors in creating personalized tours as gifts for each other; and two experiences that captured and visualized data that may potentially reflect visitors’ emotional responses to exhibits. What connects these experiences is the use of personal data, either as a gift itself or as the basis of a gift, to underpin a visitor experience. Such usage of personal data acts as “wrapping,” either to wrap the physical component in a digital layer or the digital component in a physical or physically experiential component (Koleva et al., Reference Koleva, Spence, Benford and Lane2020). We complement the explication of these experiences with a further example, a deck of museum ideation cards that focus directly on designing the ways such personal data can be collected, gifted, and disseminated.
We make three contributions based on our understanding, synthesis, and reflection on the experiences discussed here:
(i) We clarify how data can inspire design in museums, identifying the varied ways in which it can be used to better understand visitors’ engagements, deliver virtual exhibits, digitally wrap existing physical exhibits in new layers of meaning, and through these techniques provoke interpretation and enable ideation. We explain how these are supported by three data strategies of ambiguity, visualization, and inter-personalization.
(ii) We articulate how data can inspire co-design processes in which museum designers, curators, and visitors collaborate through co-ideation, co-creation, and co-interpretation, each of which generates and employs data as part of design loops.
(iii) We identify three key challenges of privacy, ownership, and transparency that arise from this data-inspired co-design approach and consider how museums might respond to them.
Table 1 acts as a summary of each of the constituents of the portfolio described here and a reference point for how each of the elements contributed to our discussion.
Table 1. Portfolio constituents and their generation and use of data
Our focus throughout is on how museum and gallery professionals and their visitors can engage in co-design with and around data. While we do not directly discuss artificial intelligence (AI) per se, we argue that understanding human perspectives on data, both how it can inspire design and how its use can become problematic, is important to understanding how future AI might support co-design within a complex landscape.
Reviewing data use in museums and galleries
Designers of many kinds (Coulton and Lindley, Reference Coulton and Lindley2019; Gorkovenko et al., Reference Gorkovenko, Burnett, Thorp, Richards and Murray-Rust2020) and their supporting industries (Raustiala and Sprigman, Reference Raustiala and Sprigman2019) have well understood the value that can be derived from using data in their creative and innovation activities (Varshney et al., Reference Varshney, Pinel, Varshney, Bhattacharjya, Schoergendorfer and Chee2013; Rousseaux, Reference Rousseaux2017; Chaudhuri and Koltun, Reference Chaudhuri and Koltun2010). This phenomenon is eminently observable in large-scale industrial settings where products and services are underpinned by datasets of often inordinate size, captured en masse in quantitative form, with a heterogeneous composition and lack of context that requires considerable data work to turn into actionable information (Kun et al., Reference Kun, Mulder, de Götzen and Kortuem2019, Reference Kun, Mulder and Kortuem2020). Mass-scale data use is also observable in scientific contexts, with researchers leveraging sizeable open datasets, or utilizing data capture techniques, including scraping digital footprints from social media such as Twitter (Lin and Ryaboy, Reference Lin and Ryaboy2013; Steinert-Threlkeld, Reference Steinert-Threlkeld2018; Zhang et al., Reference Zhang, Albrecht and Scott2018).
However, more focused and small-scale uses of data are also to be found in design, such as in cultural (Gaver et al., Reference Gaver, Dunne and Pacenti1999; Bogers et al., Reference Bogers, Frens, van Kollenburg, Deckers and Hummels2016) and technology probes (Hutchinson et al., Reference Hutchinson, Mackay, Westerlund and Eiderbäck2003) that are employed to collect longitudinal data in situ, even over the lifetime of an artifact (Benford et al., Reference Benford, Hazzard, Chamberlain and Darzentas2016). In such cases, particularly with multidisciplinary approaches, the data is formed of qualitative and quantitative sets (Darzentas et al., Reference Darzentas, Velt, Wetzel and Benford2019; Willson, Reference Willson2019) that necessitate considerable analysis and sense-making to inform the design process, and tooling is necessary to support this (Kun et al. Reference Kun, Mulder and Kortuem2018). In tandem with creativity support systems (CCSs) (Gabriel et al., Reference Gabriel, Monticolo, Camargo and Bourgault2016; Wang and Nickerson, Reference Wang and Nickerson2017), recent research has also described how data captured from ideation processes and enabling tools can shape design thinking: for example, how data describing how ideation cards are used can provide insight into creative processes and help designers reflect on how their own ideas fit within the wider design spaces in which they operate (Darzentas et al., Reference Darzentas, Velt, Wetzel and Benford2019; Perez et al., Reference Perez, Hilburn, Jensen and Wood2019).
In the creative and cultural industries, specifically the galleries, libraries, archives, and museums (GLAM) sector that includes the types of institutions at the heart of this paper, there is an increasing trend of data being employed to inform design. In this context, the data in question includes not only quantitative datasets from automated sources, but also more qualitative “human data” captured by both explicit means such as direct visitor feedback and implicit means such as interactive installations. Moreover, museums and galleries now face a variety of design challenges in terms of heightened pressure to achieve goals (Gilmore and Rentschler, Reference Gilmore and Rentschler2002; Rentschler, Reference Rentschler2007) around increased visitor diversity, footfall, and/or engagement (Gilmore and Rentschler, Reference Gilmore and Rentschler2002; Rentschler, Reference Rentschler2007), goals that data might help them achieve. And while no one can predict the future, it seems likely that the abrupt shift to online means of work and leisure during the global COVID-19 pandemic (during which this paper has been written) will only increase the importance of digitally derived data for museums and galleries, whose budgets have been pressured, sometimes to the breaking point, in the face of the collapse of physical visits.
As alluded to briefly above, museums and galleries have traditionally been seen as the collectors, curators, and interpreters of important cultural artifacts, promulgating canonical narratives that reflect and help shape the cultures they serve (Duncan, Reference Duncan1994). However, contemporary museological research (e.g., Vergo, Reference Vergo1989) and practices have challenged this tradition, drawing on post-colonial, feminist, and other critical perspectives to call for these institutions to become open to a far more diverse range of voices and interpretations, as a means of, among other motivations, justifying their value to funders and governments (Macdonald, Reference Macdonald and Sharon2006; Rentschler, Reference Rentschler2007).
As part of cultural institutions' prerogative to engage wider audiences, they face increasing pressure to overcome the negative ways they can be perceived by their prospective audiences as elitist or exclusionary (Passebois and Aurier, Reference Passebois and Aurier2004; Mason and McCarthy, Reference Mason and McCarthy2006) – something many museums are already expending effort to achieve.Footnote 1 As such, many museums need to find ways to make themselves more enticing to an extensive range of visitors in an increasingly competitive leisure marketplace.Footnote 2 Beyond broadening audiences, museums are also seeking new ways of engaging their visitors beyond traditional modes of handing down “received” interpretations. According to the academically dominant paradigm of new museology (Vergo, Reference Vergo1989; Shelton, Reference Shelton2013), visitors aren't just passive recipients of knowledge, but also active participants, requiring museums to think more deeply about participation and engagement (Simon, Reference Simon2010; Murphy, Reference Murphy, O'Neill and Hooper2019) participatory spaces (Dodd et al., Reference Dodd and Sandell2001). Giving museums the tools to capture and make sense of rich visitor data from a wealth of internal and external sources and perspectives will aid museums in the designing of such visitor experiences, whether tailored to an individual exhibition or used throughout the property, which promote personal engagement from the fullest range of the potential visitor population and better reflect connections to community, context, and heritage (Benson and Cremin, Reference Benson and Cremin2019).
Digital technologies offer potential foundations for interesting museum experiences, providing a route to engaging broader audiences and curating the new interpretations that come with them. Interactive technologies can offer a familiar mode of engagement to digitally confident audiences, reflecting their experiences of accessing information on the Internet, social media, and games. Furthermore, thoughtful design of interfaces and expectations can also provide a welcome introduction to those with low to no confidence (Spence et al., Reference Spence, Darzentas, Huang, Cameron, Beestin and Benford2020). Moreover, digital technologies bring the potential for capturing and analyzing data from and about visitors and engaging them in interpretation and co-creation.
Museums’ and galleries’ data practices commonly employ data gathering at organizational and strategic levels to shape internal and external policies and provide evidence of reach, impact, and significance to funders (Selwood, Reference Selwood2002; Gilmore, Reference Gilmore2014; O'Neill and Hooper, Reference O'Neill and Hooper2019). However, internal evaluation is only one example of how data may be used within a museum site. Personal data is fast being recognized as a valuable “new currency” (Skatova et al., Reference Skatova, ng and Goulding2014; Crabtree et al., Reference Crabtree, Lodge, Colley, Greenhalgh, Mortier and Haddadi2016), usable by empowered data subjects as an exchangeable commodity, potentially providing a secondary form of value exchange between visitor and venue beyond traditional monetary donations.
Collected or donated personal data about individual visitors can enable meaningful personalization of experiences, an area that has seen much previous research. The desire to offer differentiated experiences to diverse audiences (Falk, Reference Falk2009; Falk and Dierking, Reference Falk and Dierking2012) has fueled a growth of interest in personalization (Stock, Reference Stock1993; Oberlander et al., Reference Oberlander, O'Donnell, Mellish and Knott1998; Paterno, Reference Paterno1999; Bowen and Filippini Fantoni, Reference Bowen and Filippini Fantoni2004), including projects that have explored how to design personalized experiences and exhibitions in museum contexts (Kuflik et al., Reference Kuflik, Stock, Zancanaro and Kashtan2011; van Tuijn et al., Reference van Tuijn, Drost, Brinkerink and Baltussen2016; Lee and Paddon, Reference Lee and Paddon2017; Kontiza et al., Reference Kontiza, Loboda, Deladiennee, Castagnos and Naudet2018). Much research has focused on user modeling and recommender systems which draw on data about users’ backgrounds, interests, or behaviors (Ardissono et al., Reference Ardissono, Kuflik and Petrelli2012; Fishwick, Reference Fishwick2016; De Angelis et al., Reference De Angelis, Gasparetti, Micarelli and Sansonetti2017; Deladiennee and Naudet, Reference Deladiennee and Naudet2017; Almeshari et al., Reference Almeshari, Dowell and Nyhan2019; Castagnos et al., Reference Castagnos, Marchal, Bertrand, Colle and Mahmoudi2019; Katifori et al., Reference Katifori, Vayanou, Antoniou, Ioannidis and Ioannidis2019; Mauro, Reference Mauro2019; Mokatren et al., Reference Mokatren, Bogina, Wecker and Kuflik2019; Dahroug et al., Reference Dahroug, Vlachidis, Liapis and Pazos-Arias2021). While personalization tends to be approached in terms of matching users with relevant content, it can also focus on making an experience feel more personal by developing a personal connection between the visitor and the museum. Not and Petrelli (Reference Not and Petrelli2019), for example, describe a system for generating personalized postcards summarizing visits. Alternatively, some museums have explored personalized storytelling and play as a means of fostering personal connections (Katifori et al., Reference Katifori, Karvounis, Kourtis, Kyriakidi, Roussou, Tsangaris, Vayanou, Ioannidis, Balet, Prados, Keil, Engelke and Pujol2014; Vayanou et al., Reference Vayanou, Antoniou, Loumos, Kargas, Kakaletris and Ioannidis2019).
Furthermore, beyond the potential of personal data as a tool for personalization, Eklund (Reference Eklund2020) recently suggested a shift from designing personalized experiences in which the museum tailors experiences for visitors to interpersonal ones in which visitors directly personalize experiences for each other. Ryding et al. (Reference Ryding, Spence, Løvlie and Benford2021) explores this further by comparing two applications that enable visitors to directly control how partners, friends, and family navigate and behave in the museum, including directing what they look at and how they look at it, or to indirectly control their visit by digitally wrapping exhibits in personal messages as gifts (as we discuss further below). All three of these cases create interpersonalized and intimate visiting experiences.
The third application of data is to crowdsource and co-create content. Geismar and Mohns (Reference Geismar and Mohns2011) encouraged the Vanuatu Museum's local community to tag artifacts and archival pieces as they wished, creating crowdsourced social, local, and personal relationships around the objects. This not only fundamentally altered the themes documented within the museum but also made the content more impactful and inclusive to its local communities. Zeng and Zhang (Reference Zeng and Zhang2017) took a different approach to diversifying perspectives by crowdsourcing interpretations of art pieces from both audiences and experts. The ensuing discussions across stakeholder groups demonstrated that both the experts and non-experts had very different opinions on art pieces and took different meanings away with them. Importantly, though, the discussions showed a way to build bridges across interpreted narratives through data collection. Crowdsourcing can also be used to reflect experiences and knowledge back to the visitor. The Art Maps project (Giannachi et al., Reference Giannachi, Sinker, Stack and Benford2017) enabled audiences to link art and artists with the local area by creating walking routes that featured relevant, crowdsourced waypoints. Importantly, all these crowdsourced interventions present the data back to visitors in some form, whether making archival tags visible as with (Geismar and Mohns, Reference Geismar and Mohns2011) or by embedding the data into the experience as per (Giannachi et al., Reference Giannachi, Sinker, Stack and Benford2017). Reflecting data back to visitors can directly impact the ways they navigate physical space and interact with content, using data from visitors’ own movements to plot foot traffic and minimize exhibit congestion (Chiu et al., Reference Chiu, Tseng and Hsu2017), or it can motivate visitor engagement, for example through gamification and competition for virtual resources (Mallavarapu et al., Reference Mallavarapu, Lyons, Uzzo, Thompson, Levy-Cohen and Slattery2019).
Such approaches reflect a broader notion of the role of digital technologies in supporting co-creation (Holdgaard and Klastrup, Reference Holdgaard and Klastrup2014; Jun and Lee, Reference Jun and Lee2014; Smørdal et al., Reference Smørdal, Stuedahl and Sem2014; Avram et al., Reference Avram, Ciolfi and Maye2020). Co-creation can come from self-directed participation (like taking photos posing with art) or longer-term participation (examples include the infamous Ugly Renaissance BabiesFootnote 3 or Nipples at the MetFootnote 4). Augmented reality (AR), for example, offers an interesting way to develop this idea – it can be used to make a convergent environment that cannot necessarily be controlled by the museum or the artist, offering potential positive disruption and new ways of engagement and interpretation (Calvi, Reference Calvi2020).
In summary, museums and galleries are already employing data in various ways to help them address the challenges of broadening audiences while deepening their interpretations, from understanding the demographics, motivations, and behaviors of their audiences, to personalizing and interpersonalizing their experiences, to engaging them in acts of co-creation such as crowdsourcing. We now explore both the opportunities and challenges of data-inspired design in museums and galleries by analyzing a body of work on data-inspired co-design.
Portfolio of designs
It this section, we briefly present our portfolio of designs, chosen to reflect data-inspired co-design in their design, implementation, and iteration. Several of these were developed as part of the European Union's Horizon 2020 funded GIFT project number 727040Footnote 5 that explored the “Meaningful Personalisation of Hybrid Virtual Museum Experiences Through Gifting and Appropriation.” The summaries below outline the designs in situ and focus on their data-driven aspects.
Thresholds
For our first case study, we turn to a museum installation that was created by the artist Mat CollishawFootnote 6 in collaboration with the Mixed Reality Laboratory at the University of Nottingham. Thresholds is an example of “substitutional reality” (Simeone et al., Reference Simeone, Velloso and Gellersen2015), a location-based VR experience in which a 3D virtual model – of an entire room, in this case – is overlaid on corresponding physical objects to align physical touch to virtual digital visual and audio stimuli (Hoffman et al., Reference Hoffman, Hollander, Schroder, Rousseau and Furness1998; Insko, Reference Insko2001). We include Thresholds here because it enables the analysis of data about visitor behavior at scale, as a way of gaining insights into museum experience design. A detailed account of the design and evaluation of Thresholds can be found in Tennent et al. (Reference Tennent, Martindale, Benford, Darzentas, Brundell and Collishaw2020); the following is a brief summary.Footnote 7
Thresholds recreates the “Model Room,” an exhibition that was staged at King Edward's School in Birmingham, UK, in August 1839. There, Henry Fox Talbot presented a display of 93 “Photogenic Drawings” (forerunners of photographs), and therefore arguably the earliest photography exhibit on record. Thresholds uses the still-novel technique of substitutional reality to give contemporary audiences access to the experience of a first look at the once-radical technology of photography. By doing this, Collishaw draws a parallel between past and present, both in terms of the thrill of new mediated experiences and in terms of the tensions they provoke.
To experience Thresholds, each visitor dons a backpack PC and wireless head-mounted display (HTC Vive 1.0) that enables them to explore a room-sized VR recreation of the Model Room with up to five other visitors at a time. They are guided into an all-white physical room containing full-scale model vitrines and other physical details. Through the headset, they see a virtual recreation of Collishaw's rendition of the 1839 exhibit. This is overlaid onto the physical room so that vision, sound, and touch work in synchrony. As a result, visitors can see and hear Collishaw's recreation of the Model Room but also feel it as they walk around whenever they reach out to touch a vitrine, lean against a wall, or feel the fire burning in the grate (due to a space heater in the real world). Other real-life visitors appear as ghostlike auras, preventing unexpected collisions without distracting from the verisimilitude of the VR experience. Although the photographs in the vitrines cannot be touched, visitors can lift them up for closer inspection by hovering their hand above them, whereupon they appear to emerge onto the visitor's hand. After 6 min a clock chimes, and visitors are asked to remove their headsets, only to find themselves once more in the bright white reality of the physical exhibit. Thresholds toured across the UK, having been exhibited at Somerset House, London; Birmingham Museum and Art Gallery; Lacock Abbey, Wiltshire; the National Science and Media Museum, Bradford; and the 2019 Conference on Human Factors in Computing Systems in GlasgowFootnote 8 (Tennent and Benford, Reference Tennent and Benford2019), among others.
The evaluation of the visitor experience drew on the conventional forms of observations and interviews with selected participants, comments captured by museums in visitor books, and also on reviews in the press and on blogs. However, we also collected data directly from the technology they wore. Our visualizations of system logs of visitors’ movements in the virtual world are the object of our attention here for the light they shed on visitor behaviors.
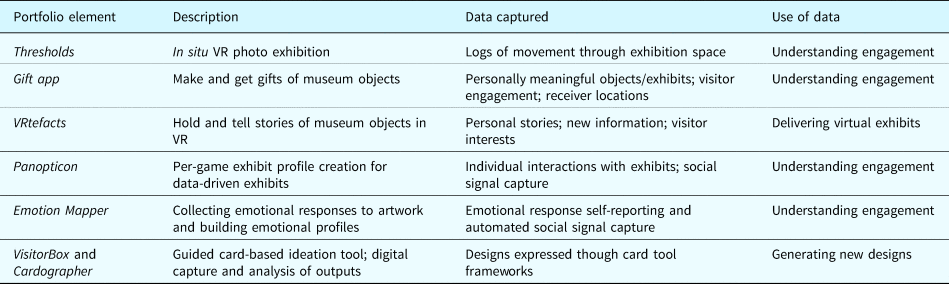
We collected 5271 complete data logs of visitors’ movements and actions in the virtual and physical exhibition including head position and orientation, hand positions and orientations, and interactions with the virtual photographs. Figure 1 (top) presents a top-down heat map of the horizontal positions of all visitors’ headsets as seen from above, set against the virtual model. Red shows the most popular locations, orange and yellow the next, green less so, while areas that are not colored were not visited at all. (Note the six physical vitrines appearing as brown rectangles.)
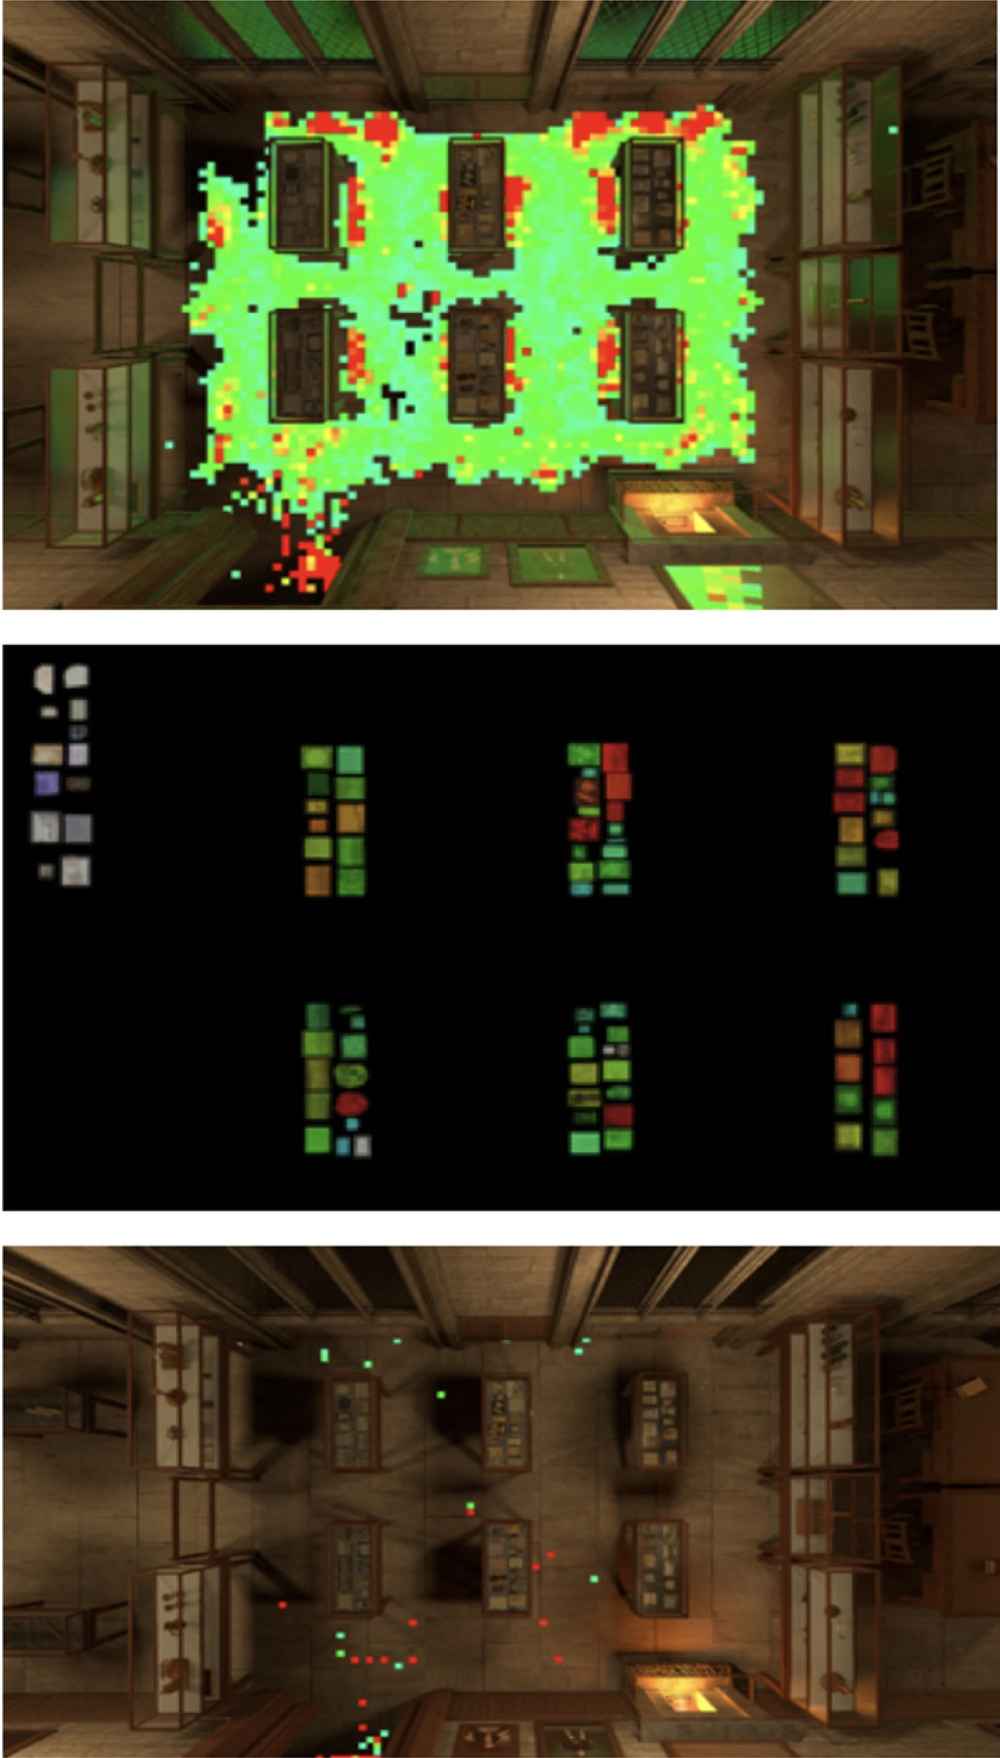
Fig. 1. Visualizing visitor behavior in thresholds. Top: heatmap of horizontal headset positions in thresholds. Middle: relative popularities of photographs based on those picked up. Bottom: spatial visualization of estimated tracking errors.
The top visualization reveals clustering around the door (bottom left) as we might expect, as this is the entry and exit point for all visitors. It also shows the edges of vitrines to be popular locations and that visitors tended to stand at their sides rather than their ends, reflecting the orientation of the photographs. They also avoided the relatively busy corridors around the outside of the room and through its center. Windows were popular locations, with many pausing to look out at the riot taking place outside the virtual room. The notable gap at the top left is where a static ghost avatar was placed so that invigilators had somewhere to stand safely in the physical room.
41% of these visitors picked up images at least once and visitors spent 2.5% of their time holding objects in total. The heatmap in Figure 1 (middle) conveys the relative popularity of images in terms of being picked up, suggesting that larger images are more likely to be picked up, perhaps because they are easier to grasp, but also suggesting the images farther away from the entrance appeared to be more popular than those near to it. This may be because it takes visitors a few minutes to become familiar with the experience, after which many move to the windows to watch the riot; following this, they move along to the end vitrines.
Finally, Figure 1 (bottom) provides estimates of the spatial distribution of tracking errors, defined as being reported positions that were either outside the physical constraints of the space or more than 50 cm away from the previously recorded point (unlikely to occur with logging at 90 Hz). The visualization shows the last reported “good” position just before the tracking error occurred. We see the most errors around places such as the entrance and windows, where many visitors adjusted their headsets, resulting in their hands covering the sensors. Errors toward the center of the room are likely due to the maximum range of the Vive lighthouse sensors placed in the corners.
The data logging from the activities of the participants in the virtual and physical space provided the design team with a solid foundation to draw insights from, especially as corroborated by invigilator observations and post-experience feedback. Longitudinal trends of the extremely detailed data captured by the technology used to deliver the experience revealed patterns that could easily be understood in ways that could inform both future attempts at substitutional reality in museum contexts and even, potentially, purely physical exhibitions, where data cannot reasonably be gathered at this level of detail. In this way, the design of future experiences was methodically informed and improved.
Gift App
Our second case study is the Gift app (Spence et al., Reference Spence, Bedwell, Coleman and Løvlie2019; Ryding et al., Reference Ryding, Spence, Løvlie and Benford2021), a mobile phone-based experience that enabled museum visitors to create a gift for a friend or family member by selecting up to three objects from the museum, taking a photo of each object, and recording a personal message about why they have chosen each object for that person. In this way, gift-givers can compose a personally meaningful hybrid physical/digital experience for a recipient, who can then “unwrap” and experience their gift of digital data during a visit to the museum – or, if a visit is not possible, from wherever they are.
Large-scale in-the-wild deployments of the Gift app at the Brighton Museum and Art Gallery, UK, and the Munch Museum in Oslo, Norway, enabled us to capture data logs about who (or more precisely, which specific browser and device combination) had sent gifts, how many object photos and corresponding audio files (1, 2, or 3) each gift contained, how many separate gifts a giver sent to how many others, when and how often those gifts were opened, and on how many separate browser/device combinations. The approximation of browser/device combination for individual user was necessary for the sake of identity protection but functioned well in the aggregate: in one edge case, a gift made on one combination and viewed on the same one at a later date was likely to have been shown to a receiver who lacked an adequate device of their own, while a single gift viewed by dozens of unique devices would likely have been shared on social media. For the most part, gifts were viewed by only one other browser/device combination and sometimes by the giver's browser/device combination as well. We drew no conclusions about individual cases, of course, but our interpretation of these patterns of behavior are not only likely but are confirmed by a subset of participant interviews conducted in Brighton (n = 69 across 2018–2019).
The app was developed by our project partners, the artist group Blast Theory, who held the images and audio files that composed each gift according to their own terms and conditions (which followed all UK legal requirements for data handling, including GDPR). They looked through the photographed objects and matched them to their physical locations within both the Brighton and Munch museums, giving us the metadata necessary to plot locations and movement without sharing the corpus of personal digital media itself. While the manual labor was intensive, it was necessary to make sense of the vast array of objects at Brighton Museum, which were sometimes captured en masse from a distance or so close that the original object was difficult to discern, or when users photographed items in the café, gift shop, hallways, or even outside. The process was far easier in the more sparsely arranged Munch Museum, though here, it was necessary to pay attention to dates in the metadata to account for the regular rearrangement of paintings. [More detail on our interview findings can be found in Spence et al. (Reference Spence, Bedwell, Coleman and Løvlie2019)].
We developed a series of visualizations of the resulting datasets which comprised several hundred participants and objects with a view to providing insights into visitors’ behaviors. The first (Fig. 2, top) shows how many users progress through the different stages of the gift-giving workflow. In other words, it shows how many users stop using the app at each key touchpoint of the visitor experience, which is necessarily more complex and time-consuming for givers than for receivers. In this case, we can see that many visitors are lost during the first introductory stage, after which most are retained, though not everyone goes on to include a second or third object in their gifts (which was in line with our expectations). This insight is useful for identifying key weaknesses in the overall app or ways in which it is deployed in a particular museum (e.g., having museum staff on hand to answer questions, or providing significant signage at convenient locations). It also sets a benchmark as to expected behavior with the app that can help museums plan deployments and anticipate likely uptakes in future deployments.
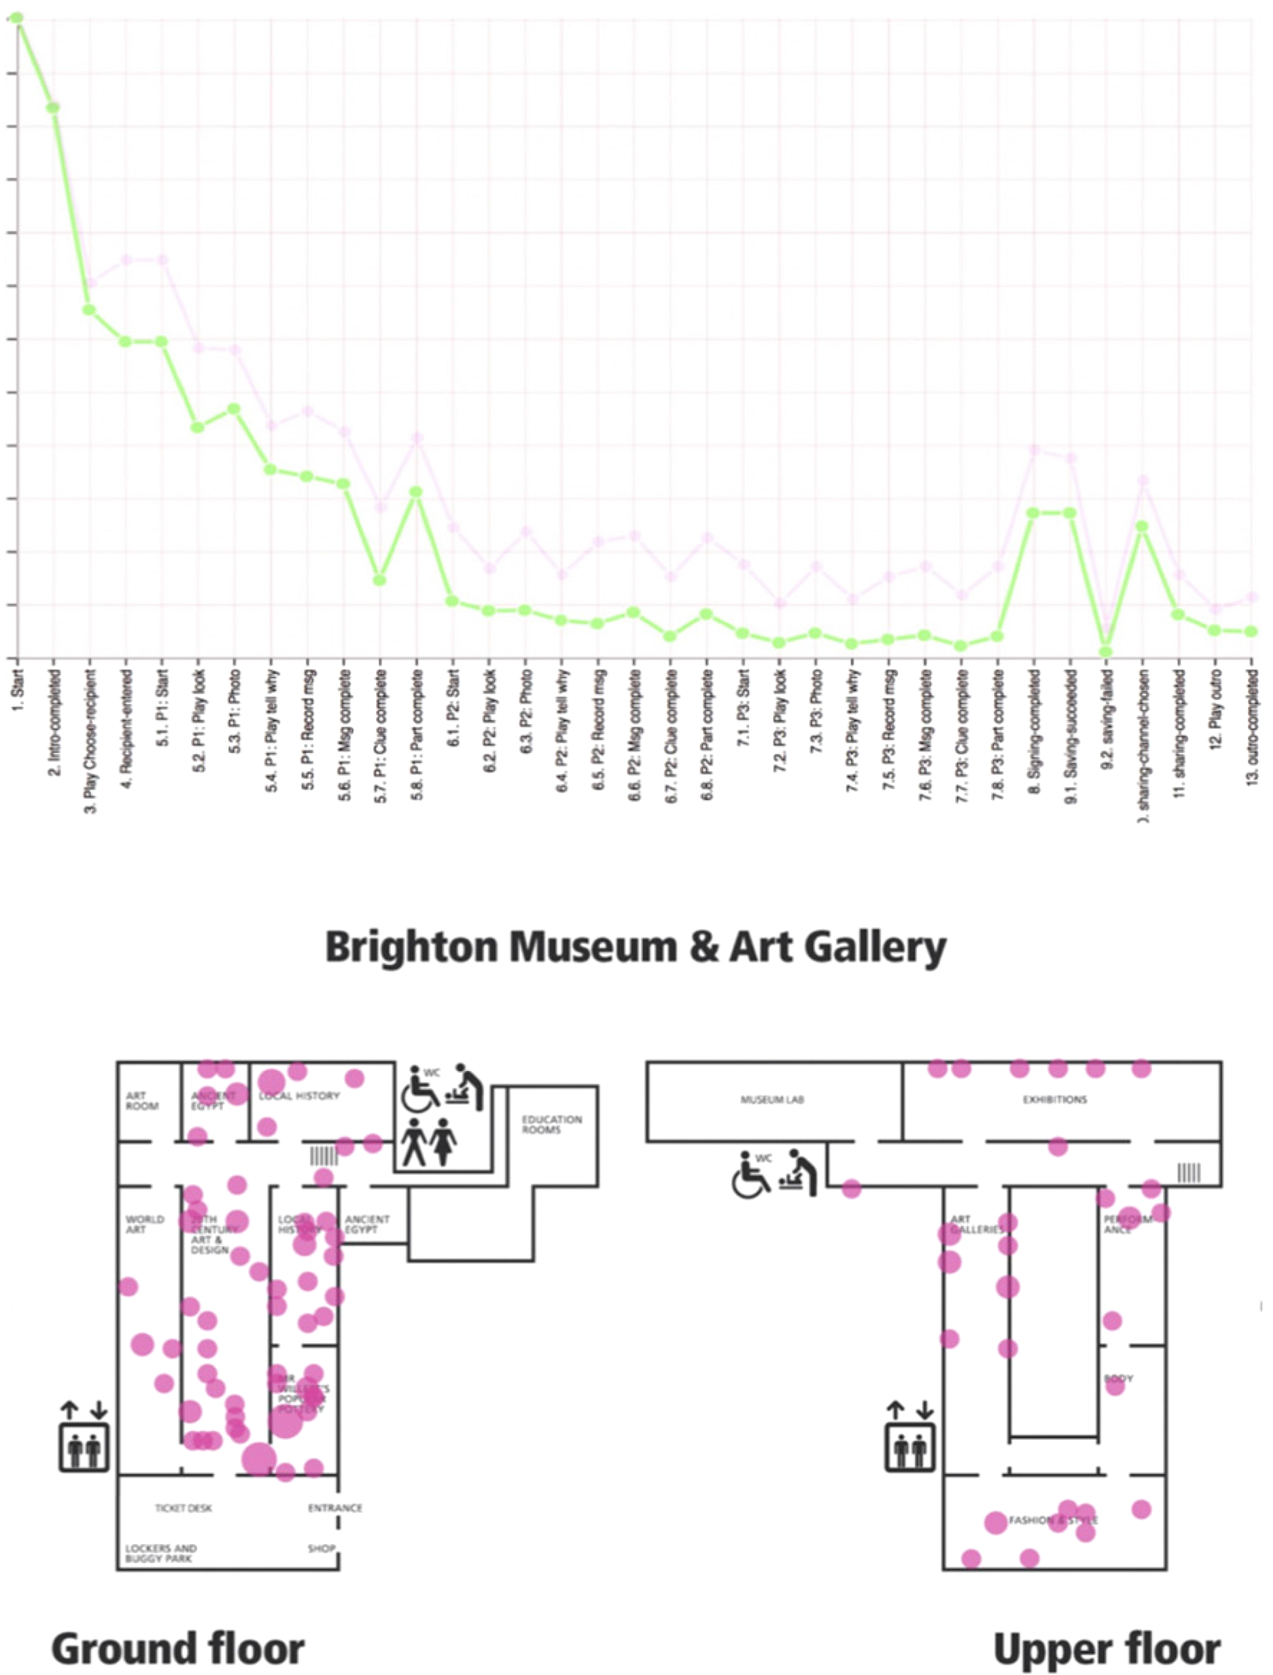
Fig. 2. Visualizing interactions with the gift app. Top: visualizing progression through the gift app experience (green line for Brighton Museum data and pink line for Munch Museum data). Bottom: map showing the locations and popularity of gifted objects at Brighton Museum.
Our second kind of visualization shows the relative popularity of those museum objects that were chosen as gifts, overlaid on a map of the museum. The required human processing of the data described above reveals a mismatch between the hosting venues’ inventory classification and visitors’ different interests, one that cannot easily be solved by automation. This is a challenge of granularity and intent. For example, when there are multiple objects in a single photograph, particularly small items in a single cabinet, does the gift-giver intend to choose the entire cabinet as the subject of the photograph, or just one of its artifacts, or a subset? As the museums have varying types and degrees of individually inventorying their exhibits and objects, it can be challenging to automate this. Figure 2 (bottom) shows the locations (pink spots) and popularity (relative to size of pink spot) for the Brighton Museum and Art Gallery, revealing how visitors explored the museum widely, often venturing into some of its less frequently visited galleries in search of unusual gifts, which perhaps reflects the non-linear and eclectic nature of the museum's collection. (Rooms with no pink spots are either closed to the public or house the gift shop and ticket counter.) However, the most popular areas and objects were those nearest the entry and exit, perhaps reflecting the fact that these are some of the museum's most popular objects on display. This information might inform a future rearrangement to prevent congestion near the entrance and entice visitors to less frequently visited areas.
Our third visualization is an extended form of social network graph. The visualization generates network-style representations of gift-giving, showing who gave which objects to whom – or, again, which combination of browser and device gave to which other combination of browser and device. Both giving and receiving devices are represented as pink nodes in the graphs. The things that they give are represented as green nodes. Links from devices to things show whenever the former included the latter in a gift. Links from things to people show whenever the latter opened the former as part of viewing a gift. Figure 3 shows an example of such a visualization generated from the Brighton Museum data. Figure 3 (top) gives an overview of the entire dataset, revealing clusters of gift exchange involving discrete subgroups of participants, and that these appear to involve different patterns of gift-giving behavior in terms of the choice and numbers of museum objects given, how they are combined into gifts, and also the extent to which these are reused (e.g., given to multiple recipients).
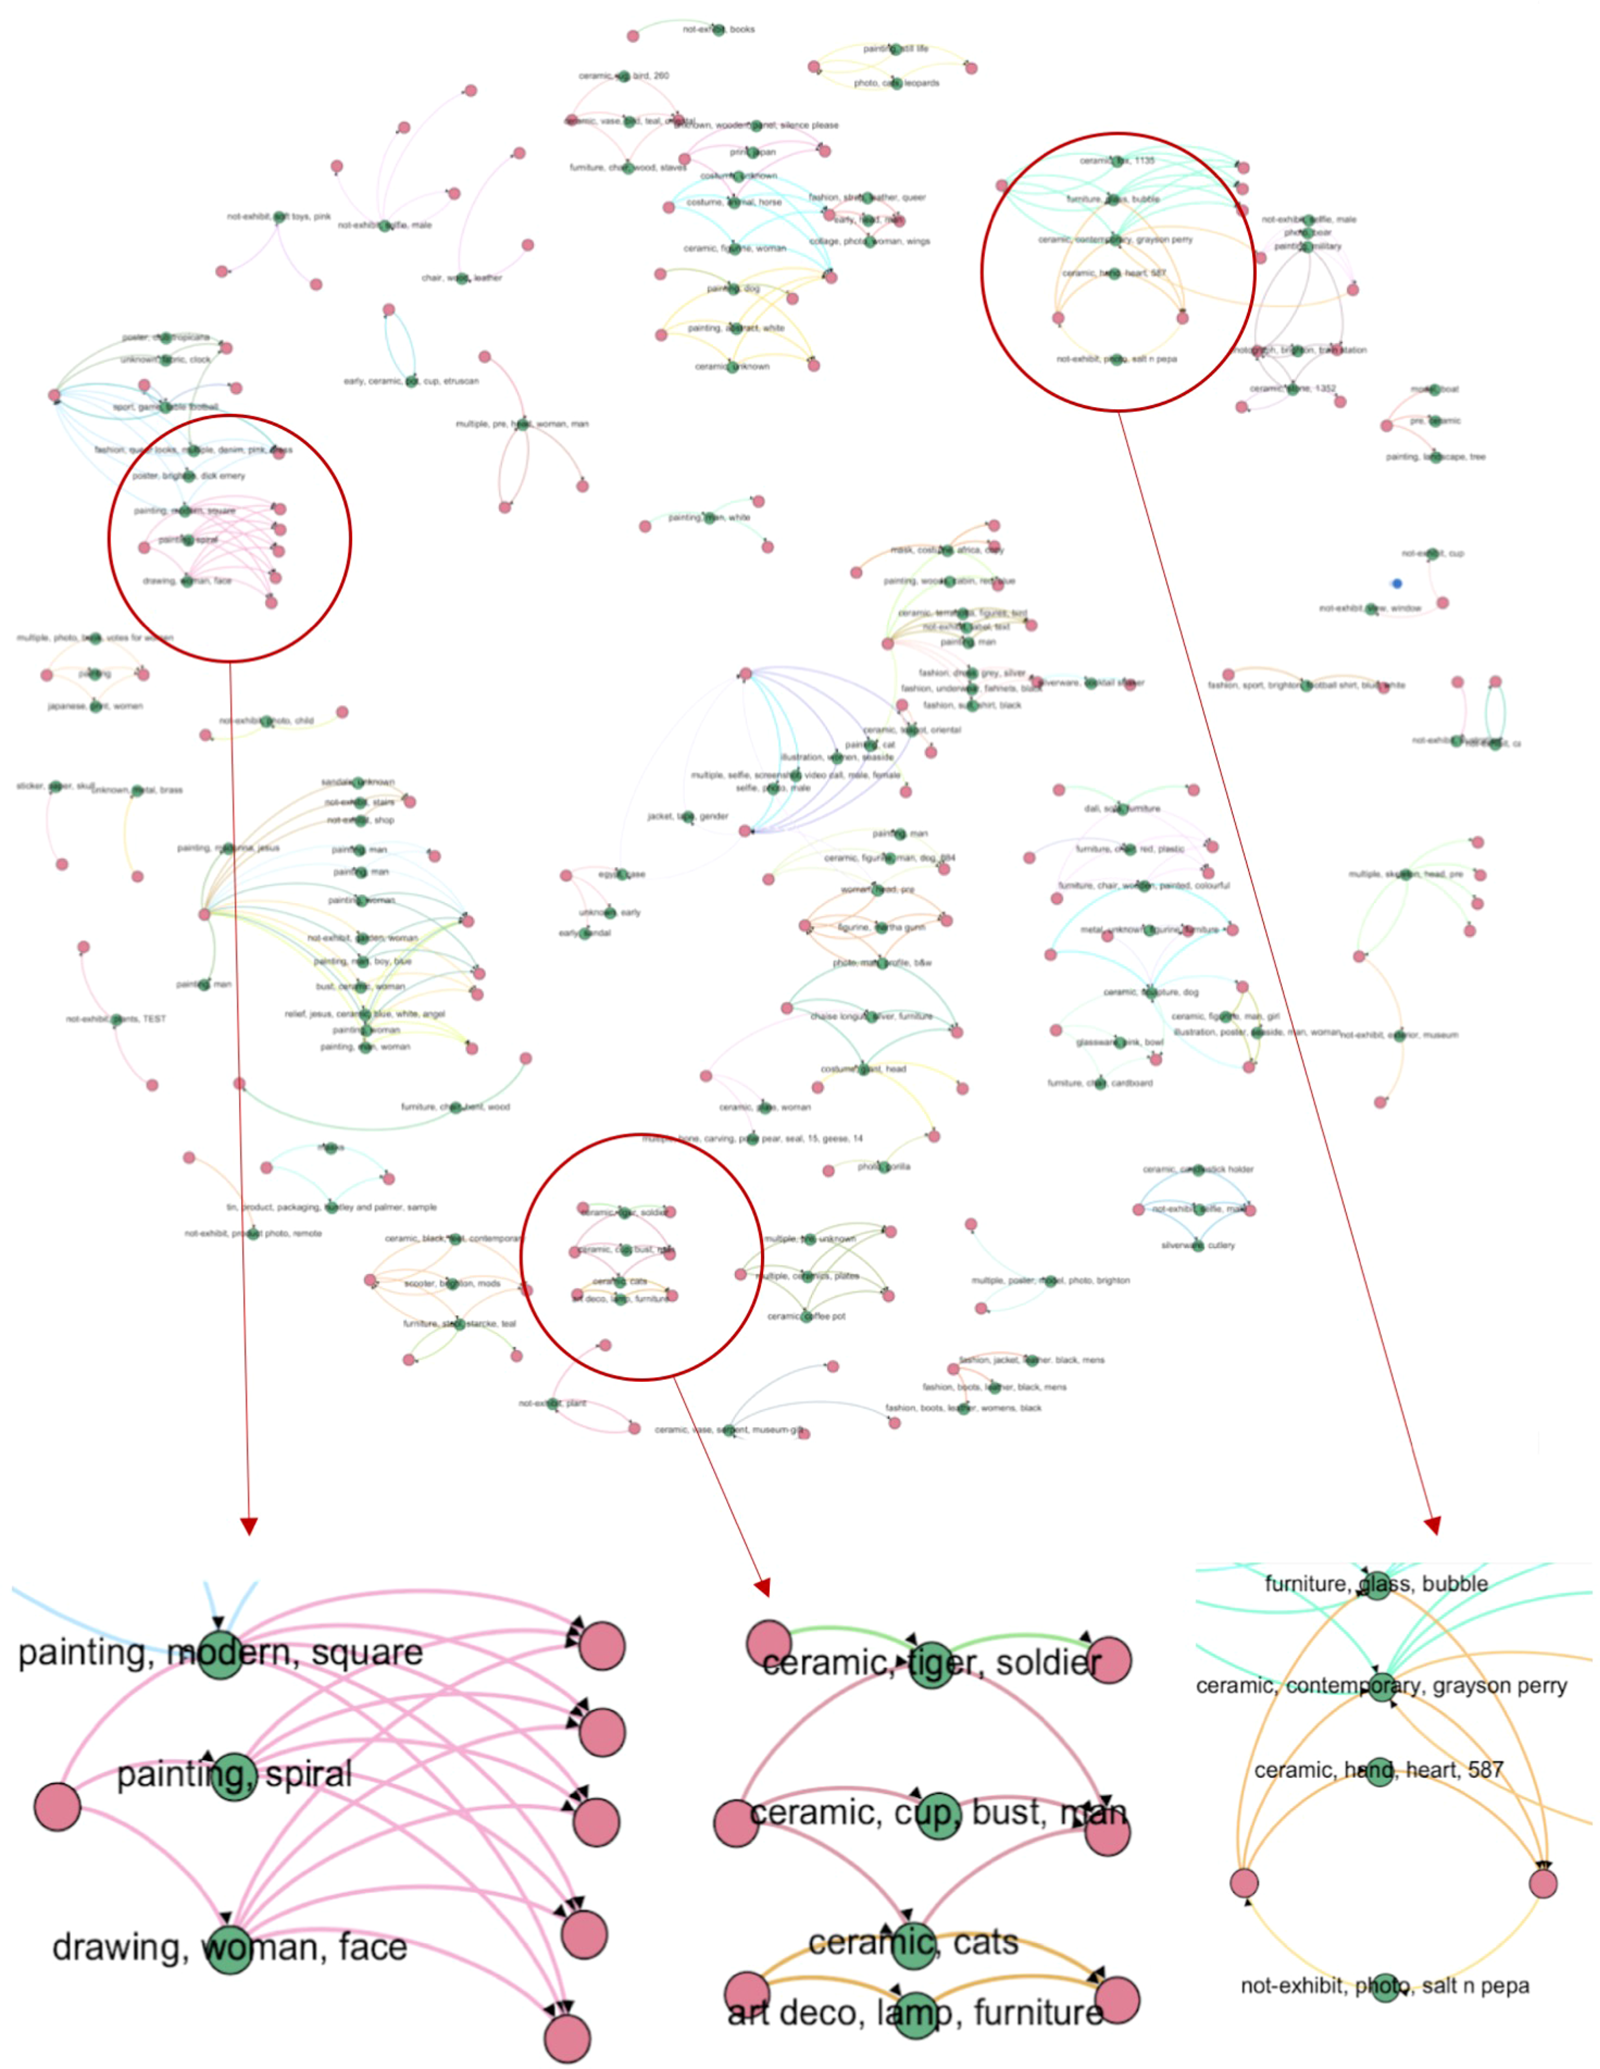
Fig. 3. Visualizing patterns of gift exchange. Top: overview of the entire dataset from the Brighton Museum deployment as a network graph. Bottom: zooming in to identify three examples of gifting behaviors.
Zooming in for a more detailed inspection (Fig. 3 bottom) reveals several interesting kinds of gift behavior. Left, we see one person who has made a gift containing three objects and then shared it with five others who opened it. Middle, we see three people have made gifts for three others, where their gifts contain several objects in common. Right, we see an example of reciprocation between two individuals. Such images suggest the potential to inform our understanding of the social dynamics of gifting in museums – do some individuals act as “influencers” perhaps, and is reciprocation a driver of this kind of gifting?
VRtefacts
VRtefacts (Spence et al., Reference Spence, Darzentas, Huang, Cameron, Beestin and Benford2020, Reference Spence, Darzentas, Cameron and Benford2021) was born of a combination of our explorations of gifting, our experiences with digital museum experiences and passive haptics, and our work on a 3D scanning workflow suitable for creative and GLAM practitioners. The focus was on investigating how we could enable visitors to more closely engage with exhibited artifacts and give them a mechanism to contribute their own personal stories and interpretations, which could then be gifted as contributions to the hosting venue.
We developed a mixed reality exhibit that placed visitors in a virtual museum space where they could physically interact with 3D prints of the selected objects. The exhibit was deployed to the public in May of 2019 in collaboration with the Derby Museum and Art Gallery,Footnote 9 the hosting venue. We used artifacts from the collection of the new Museum of Making, already 3D scanned by museum staff, and then 3D printed them to serve as trackable and handleable props, in a sense turning them into controllers. Therefore, in the virtual space the participants, wearing a VR headset, interacted fully with the exhibit, seeing a 3D model with photorealistic textures that they could explore as they wished, while in the real space, they were manipulating a 3D-printed facsimile.
Six objects from the museum's collection of 3D-scanned objectsFootnote 10 were chosen as exemplars for the experience. These ranged from relatively geometrically simple objects, such as a toolbox,Footnote 11 to detailed and intricate objects like the Rolls-Royce Eagle Aero engine. Three of the six objects were printed at palm-sized scale as seen in Figure 4, while 3D scans of the other three were represented at the same scale “inside” a VR vitrine with a physical counterpart, a Perspex box that could function as a handheld display case when the objects within would be too fragile or awkwardly shaped for 3D printing. The three 3D-printed objects and the display case were tracked using attached Vive trackers,Footnote 12 which are compatible with the HTC Vive Virtual Reality ecosystem that was used for the experience.
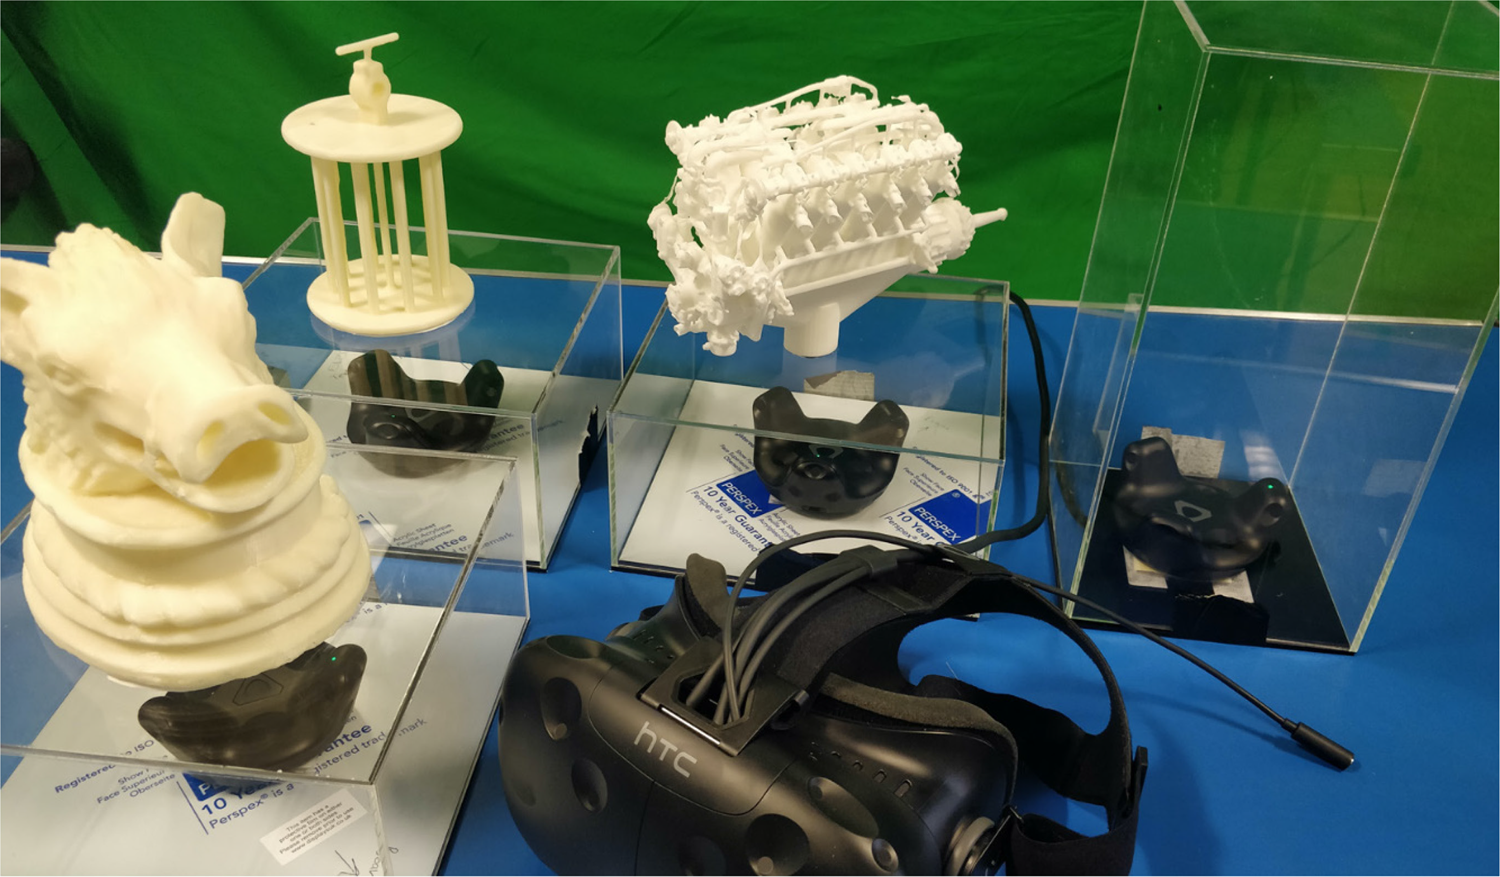
Fig. 4. 3D printed VRtefacts with their trackers and the trackable display case.
The experience itself was designed to give visitors the opportunity to engage with the artifacts more closely, to handle and manipulate them as they wished, and to give them the sense that, when ready, they would be able to tell their own story, inspired by the artifact, that would be recorded as a personal interpretation of the object and become a future part of the exhibited collection of the museum, forever linked to that artifact.
The experience was facilitated by a researcher who acted as a Host to the visitor. The Host managed the visitor's entire interaction, from setting expectations and coaching them in the use of the headset as necessary, to inviting the choice of objects, to surprising the visitor with the corresponding physical object on the table in front of them, to encouraging them to share a “story” of any kind inspired by the artifact. The entire process was recorded both in the real space and in VR, thus generating a rich digital footprint from the experience that was added to the digital content. Of the 24 participants, all expressed that they believed that the engaging haptic interaction with the artifact helped them contribute much richer narratives to the venue.
As with Thresholds and the Gift app, the activity of the users was recorded, both as composite video and as serialized data from the virtual space, including the position of the visitor's head and their gaze from the headset, and the interactions they made with the objects, as seen above in Figure 5. We are using position and gaze information to inform the next iteration of the VR storytelling, especially as it can inform user choices in the gallery and perhaps make them less reliant on the Host to help them choose their objects. The automatically gathered data on position and gaze can also be an interesting and novel method for approaching the currently unexplored experience of selecting VRtefacts stories to watch. Rather than having users select from a list of story titles or other commonly used mechanisms, we could offer them the story that best matches their own pattern of attention within the VR space, its 2D representation, or perhaps the actual artifacts in situ.
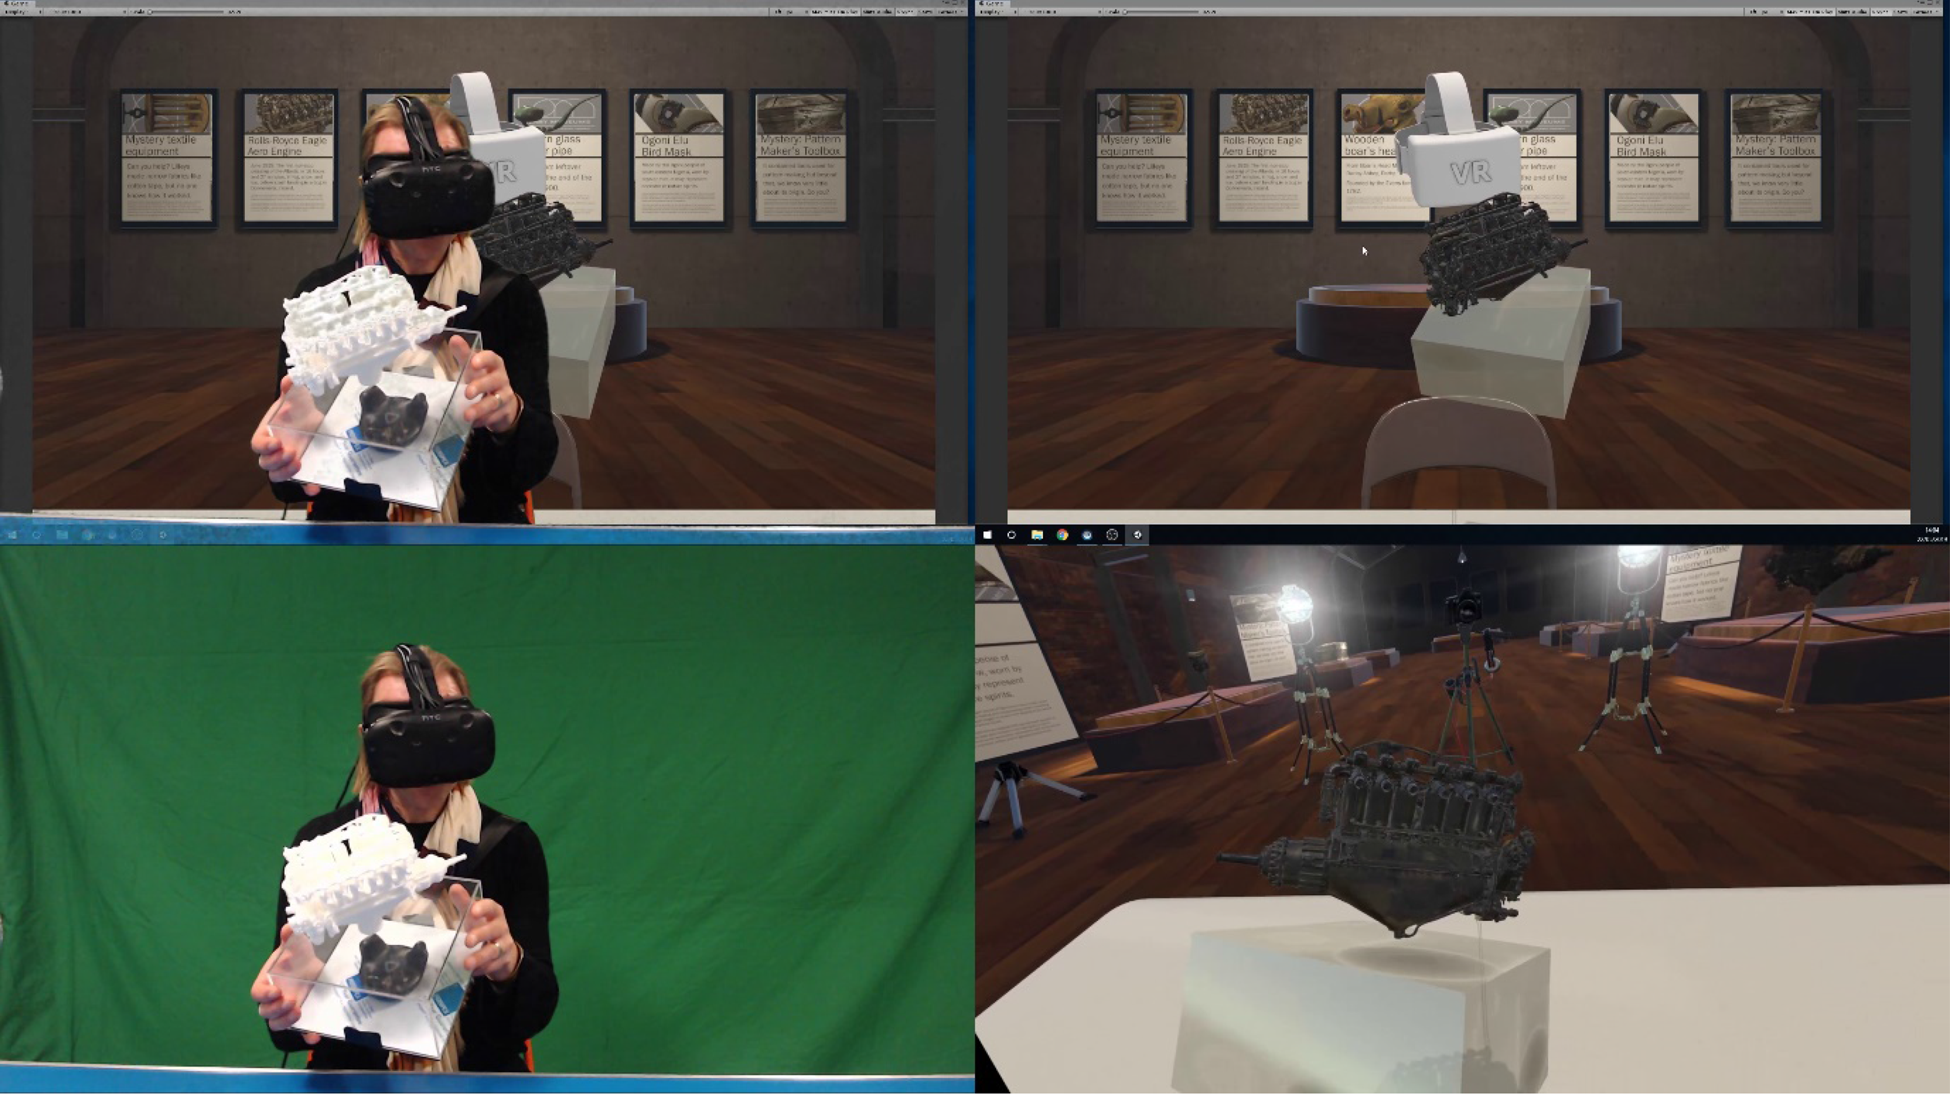
Fig. 5. An example of the data footprint from video sources. Four perspectives from a visitor's experience.
Unlike with Thresholds, users’ hands were not tracked in VR as controllers would have interfered with the haptic experience we sought to explore, and user hand movements can be seen and interpreted easily through the video already capturing their stories for the museum. However, this log data was reviewed to inform interactions of the experience and future projects using similar VR interactions.
More relevant to VRtefacts is the capture of the multiple perspective narratives (first person and third person perspectives and audio) that serve as content for the next stage of the project: the dissemination of the user-contributed content through engaging interactions with the artifacts. In other words, each recorded story is added to the corpus of information and interpretations of the artifacts, enriching its history and the meaningful engagement of future visitors with them. In this way, the captured data both drives the experience for individual storyteller-visitors and informs the design of the follow-on experiences of audience-visitors, who may in turn choose to contribute their own stories. In this situation, the priorities of “new museology” (Vergo, Reference Vergo1989) are key. There is no correct or incorrect story to tell about an object when the story is personal, no predetermined metadata to enter. Curators have only their own institutional and professional concerns to dictate their use and presentation of stories. Of course, there is the perpetual issue of curating content generated by members of the public, but in a hosted experience such as VRtefacts, guidelines are established at the outset, and any violations of those guidelines can be flagged immediately. Curators can create their own categories by which to select which stories to promote depending on the needs of whichever exhibition, theme, or related event is relevant at the time – or leave it to the visitor's gaze and head position to decide. The VRtefacts approach, therefore, aims to provide maximum flexibility for curators while reducing their additional workload to a minimum.
Panopticon
The Panopticon project again involved a melding of different approaches instantiated as a visitor experience. In this case, the concept was to utilize computer vision technology to recognize the social signals that visitors expressed with their faces, which would generate a real-time “engagement” measurement while the visitors were interacting with exhibits. (Note that photographic images of faces were never captured; the only data necessary for detecting the social cues related to emotions are the relationships between points such as eyes, mouth, nose, and jawline, and only these are subjected to algorithmic analysis.) This data-driven approach was woven together with a privacy-by-design commitment, by which a core requirement of the design is to communicate to the visitors the nature of the data being collected, and its value to them and to the hosting venue.
For this experience, we partnered with the National Videogame Arcade,Footnote 13 a museum hosted at the time in the city center of Nottingham. It offered a comprehensive collection of videogames from their inception up to current offerings. Their exhibit featured arcade cabinets and consoles, refurbished to working condition and available around the museum's space for visitors to interact with. These were the focal point of our design intervention, as they were well-defined interaction points. The venue had an interest in gaining a clearer picture and understanding of how the cabinets were used, such as times played per day and how long an individual visitor stayed with them. They were interested in particular how the visitors engaged with the game exhibits. Knowing whether they expressed frustration, engrossment, anger, happiness, sadness, or the like would help the venue make better decisions on curating their large collection within their limited physical space and on delivering more engaging, exciting, and pleasurable experiences for their visitors.
A key challenge with this approach was the capture and use of the data, which, while key to the objectives, had to be done in a responsible way. The game exhibits were augmented with a Raspberry Pi-basedFootnote 14 “Panopticon Box,” whose camera was pointed at the current user of the exhibit. Using computer vision technology trained on a dataset designed to recognized social signals from facial expressions, the Panopticon boxes could determine a reasonable measure of engagement, composed of measurements of happiness, sadness, frustration, and anger. This was done for the duration of the visitor's engagement with the game exhibit. However, in order to adhere to our privacy-by-design approach, we opted to collect the data not only for the venue's analytical purposes, but also to drive an overarching visitor experience that would explain and contextualize the data collection to visitors.
Each visitor was given a physical token – a 3D-printed Pac-Man ghost – which contained a unique NFC tag that they could take to the “onboarding station”, a PC with an NFC reader, and touchscreen where they could scan their token and create a simple avatar of themselves. Following this, they could place their token on the reader of the Panopticon box of any exhibit they wanted to play. By doing so, they opted for data collection. If there was no token on the reader, the camera was not enabled, and the play experience was not interrupted. Removing their token automatically stopped the recording. The recorded data assigned to each token changed its avatar over time. For example, the avatar would become elated if their measurements showed excitement and engagement, or angry if there was frustration, as seen in Figure 6. visualizations of the overall or per-game experience gave visitors a picture of what exhibits they seemed to enjoy, or were better at, thus inviting self-reflection or competition with fellow visitors.
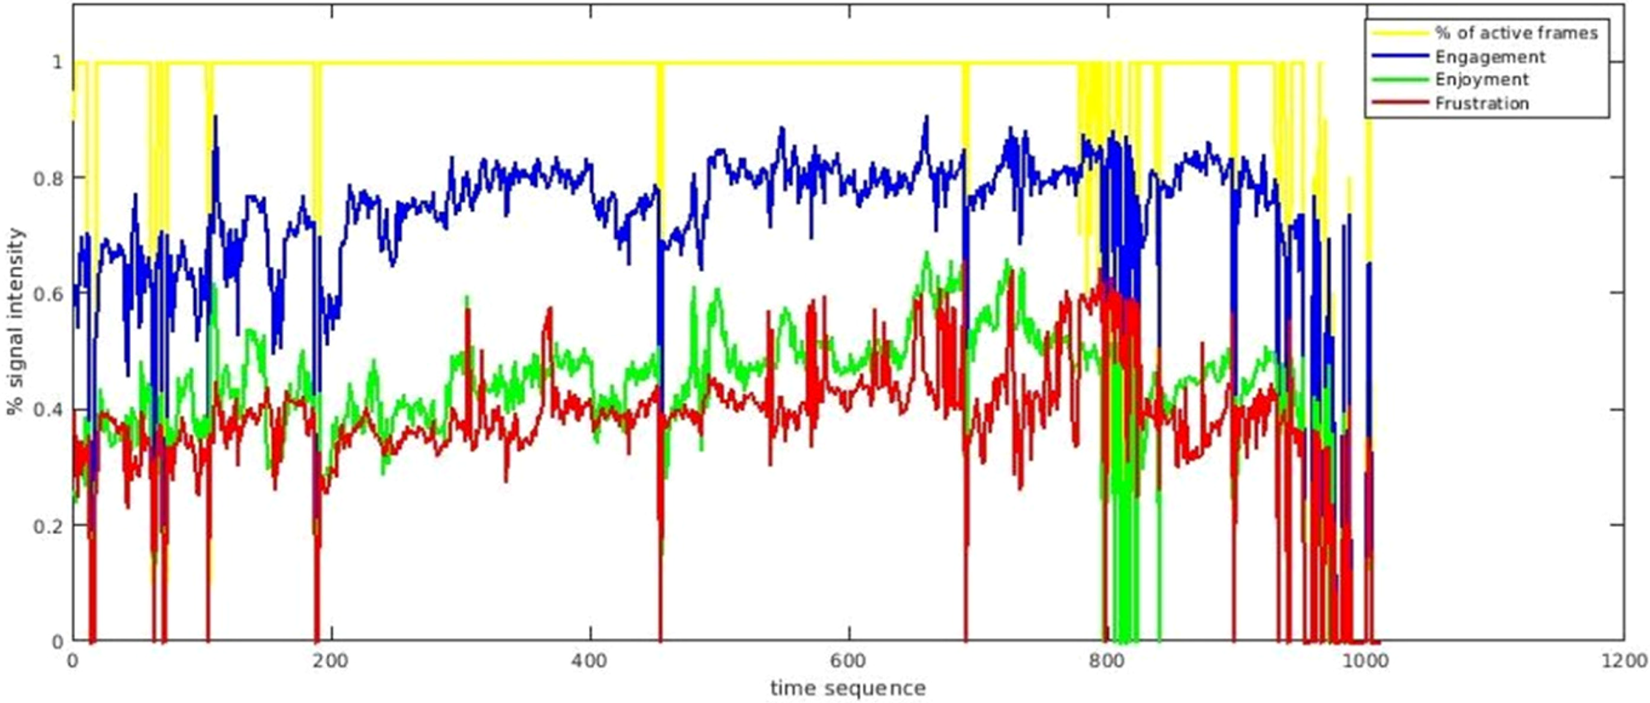
Fig. 6. Example of the Panopticon data track: green for enjoyment (smiling and laughing), blue for engagement (focus and attention), and red for frustration (frowning and grimacing).
Before leaving the venue, the visitors could revisit the onboarding station, where they were presented with a choice of contributing their data to the venue for a suitable reward, in this case, free venue membership (there was a subscription at the time) or destroying it. They could also retain their token for future visits to continue evolving their avatar. Therefore, the individual visitors were always in control of their data footprint. This data-driven, privacy-by-design approach empowered visitors with the option of informed consent and incentivized them to grow the dataset and contribute it to the venue.
Emotion Mapper
Following Panopticon's approach, we refined the design into a modular platform to support GLAM institutions in the capture and analysis of visitor emotion data. The platform, titled Emotion Mapper, can be customized for each museum or gallery and can accept emotion data from several sources, ranging from emotion reporting questionnaires to automated systems such as the computer-vision-based method used in Panopticon. Thus, the data capture sources can be tuned to the host institution and have varying focus scales, from individual exhibits to the entire visiting experience. The recorded data is stored in an online back end and can be reviewed by researchers and museum practitioners through bespoke visualizations that update in real time, giving insights into visitors’ self-reported emotional responses and the emotional interpretations or social signals captured from automated mechanisms. As the analysis of the data is achieved in real time, the data can also be presented back to the visitors during their visiting experience, helping them to reflect on their emotional responses.
We had the opportunity to apply Emotion Mapper into practice in the summer of 2019 at the Munch Museum in Oslo, Norway. An experience titled Sensitive Pictures, which included Emotion Mapper as a module in a mobile web app, was piloted to gallery visitors for 4 days. The web app used their ticket number to start their own unique and anonymous data footprint. It then presented the visitors with six emotions, each one corresponding to one of the paintings, as determined by the museum's curators. When the visitors picked an emotion, they were guided to the painting and then would listen to a short piece of fiction related to the emotion, as seen in Figure 7. Following this, they were asked to type into the app how they were feeling, and to rate how happy/unhappy and excited/calm they were feeling on two sliders.
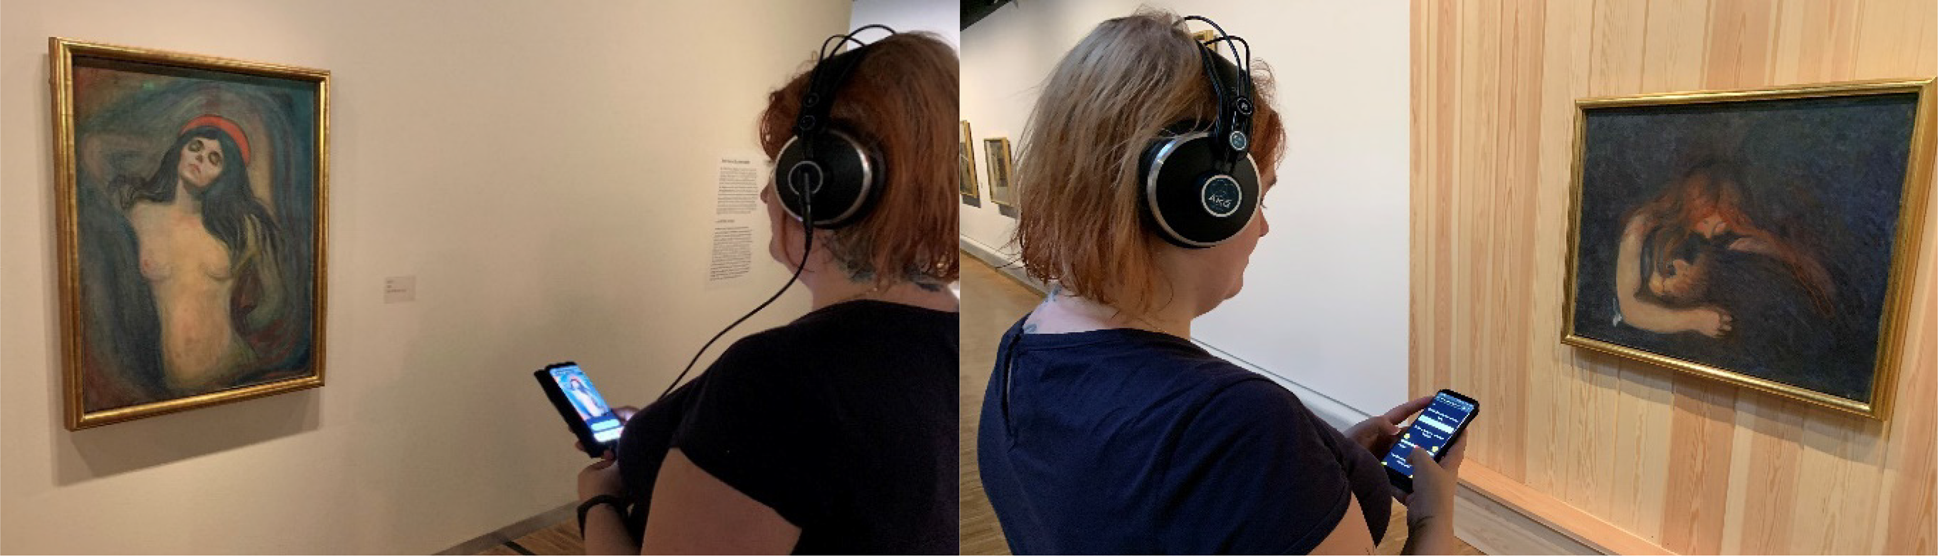
Fig. 7. (Left) Listening to the audio track for the Madonna. (Right) Completing questionnaire at the Vampire during sensitive pictures.
Upon exiting the gallery space, the visitors were invited to engage with an interactive experience, where they would enter a private booth with a screen, a camera, and a candlestick telephone attached to a wooden box. Inserting their museum ticket, which (as with Panopticon tokens) had been augmented with a unique NFC tag, into a slot in the wooden box triggered that part of the experience. The phone rang, and answering it started a simulated “time traveling” video call with Edvard Munch (who died in 1944). The video was chosen based on the painting to which the visitor had reported the biggest emotional reaction. During the simulated call, the camera in the booth used the same social signal recognition technology as Panopticon had in order to capture the visitor's visible emotional responses, which was also added to their profile. (Again, as with Panopticon, only data points derived from facial imagery were analyzed; photographic images of faces were never captured.) At the gallery's exit, visitors were asked whether they would like a copy of their emotional data: a postcard printed with their emotional data in a visualization based on the Circumplex Model of Affect (Russell, Reference Russell1980), as seen in Figure 8. This element of the overall Sensitive Pictures experience aimed to make a direct connection between private and transparent use of visitor data, style of visualization, and real-time representation of the visitor's data to them in order to promote reflection and engagement with the gallery and its objects.
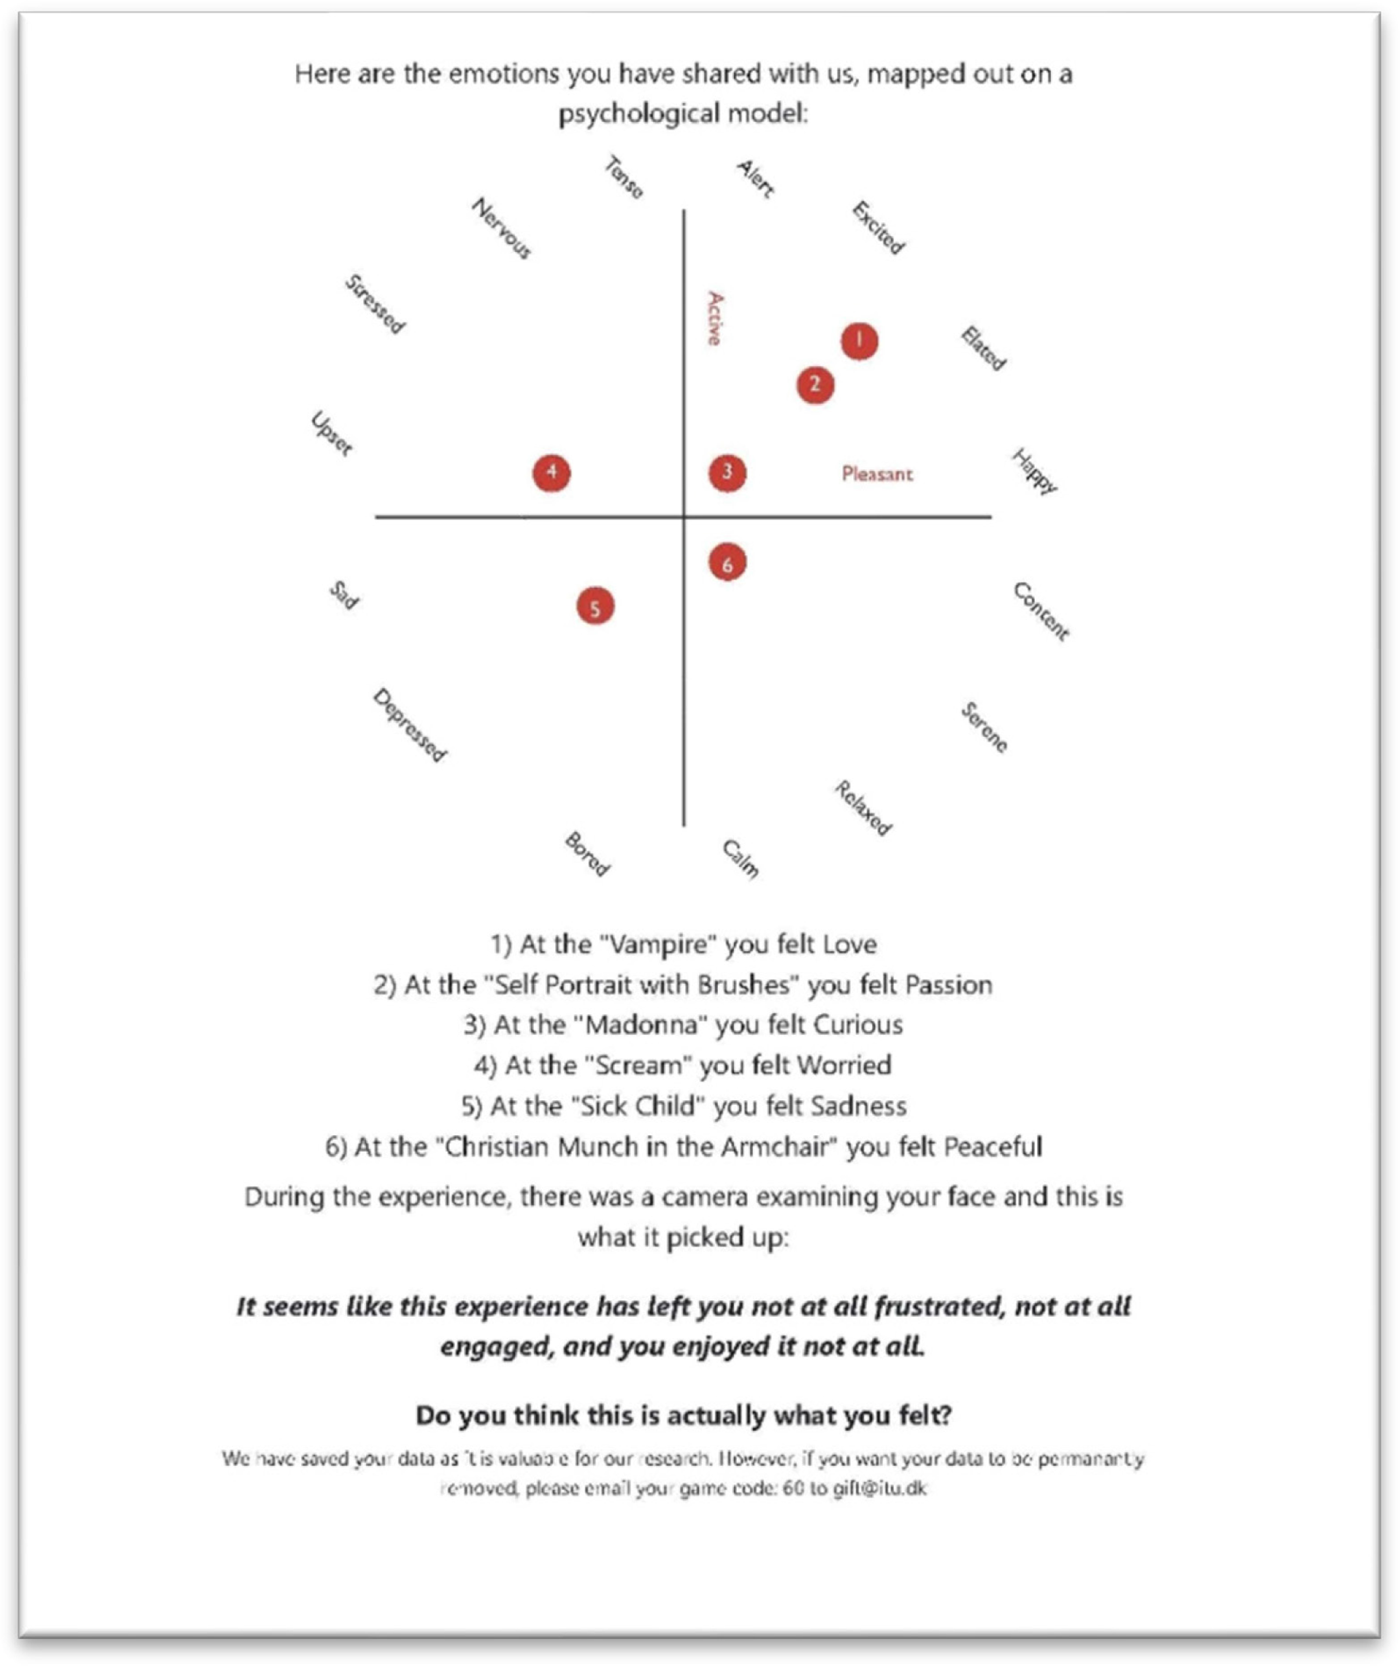
Fig. 8. An example of a visitor's printed postcard with their emotion data in the circumplex model.
Over the course of the event, 132 visitors completed the entire experience, while a further 65 engaged with part of it. From this data, the instance of Emotion Mapper customized for the Munch Museum generated a dataset, as seen in Figure 9, aimed not at visitors but at the museum as an institution. The visualizations made available to Munch Museum professionals showed aggregate information aimed at gaining insights into their visitor base rather than individual information aimed at increasing enjoyment and engagement. For example, the top half of Figure 9 shows a strong tendency for visitors to self-report unpleasant emotional responses, especially strongly “active” unpleasant emotions corresponding to nervousness, stress, and upset when viewing The Scream. Of course, this is their most famous and popular painting, meaning that unpleasant emotions do not necessarily correspond to undesirable displays. By contrast, responses to Christian Munch in an Armchair at the bottom of Figure 9 show a more even distribution of responses, though primarily pleasant and less “active”: those corresponding to happiness, content, and serenity. These types of insights can provide a real-time evidence base for understanding visitor responses, shaping the likely emotional arc of an exhibit, and devising any number of other program and design activities based on these valuable and actionable insights into the emotional responses of their visitors. This may become even more important in the future, as GLAM sector institutions seek to build on any successes they have had during their enforced closure (in the UK as in many other countries) due to the COVID-19 pandemic and find new ways to achieve – and demonstrate to funding bodies – meaningful engagement with new and existing visitor groups.
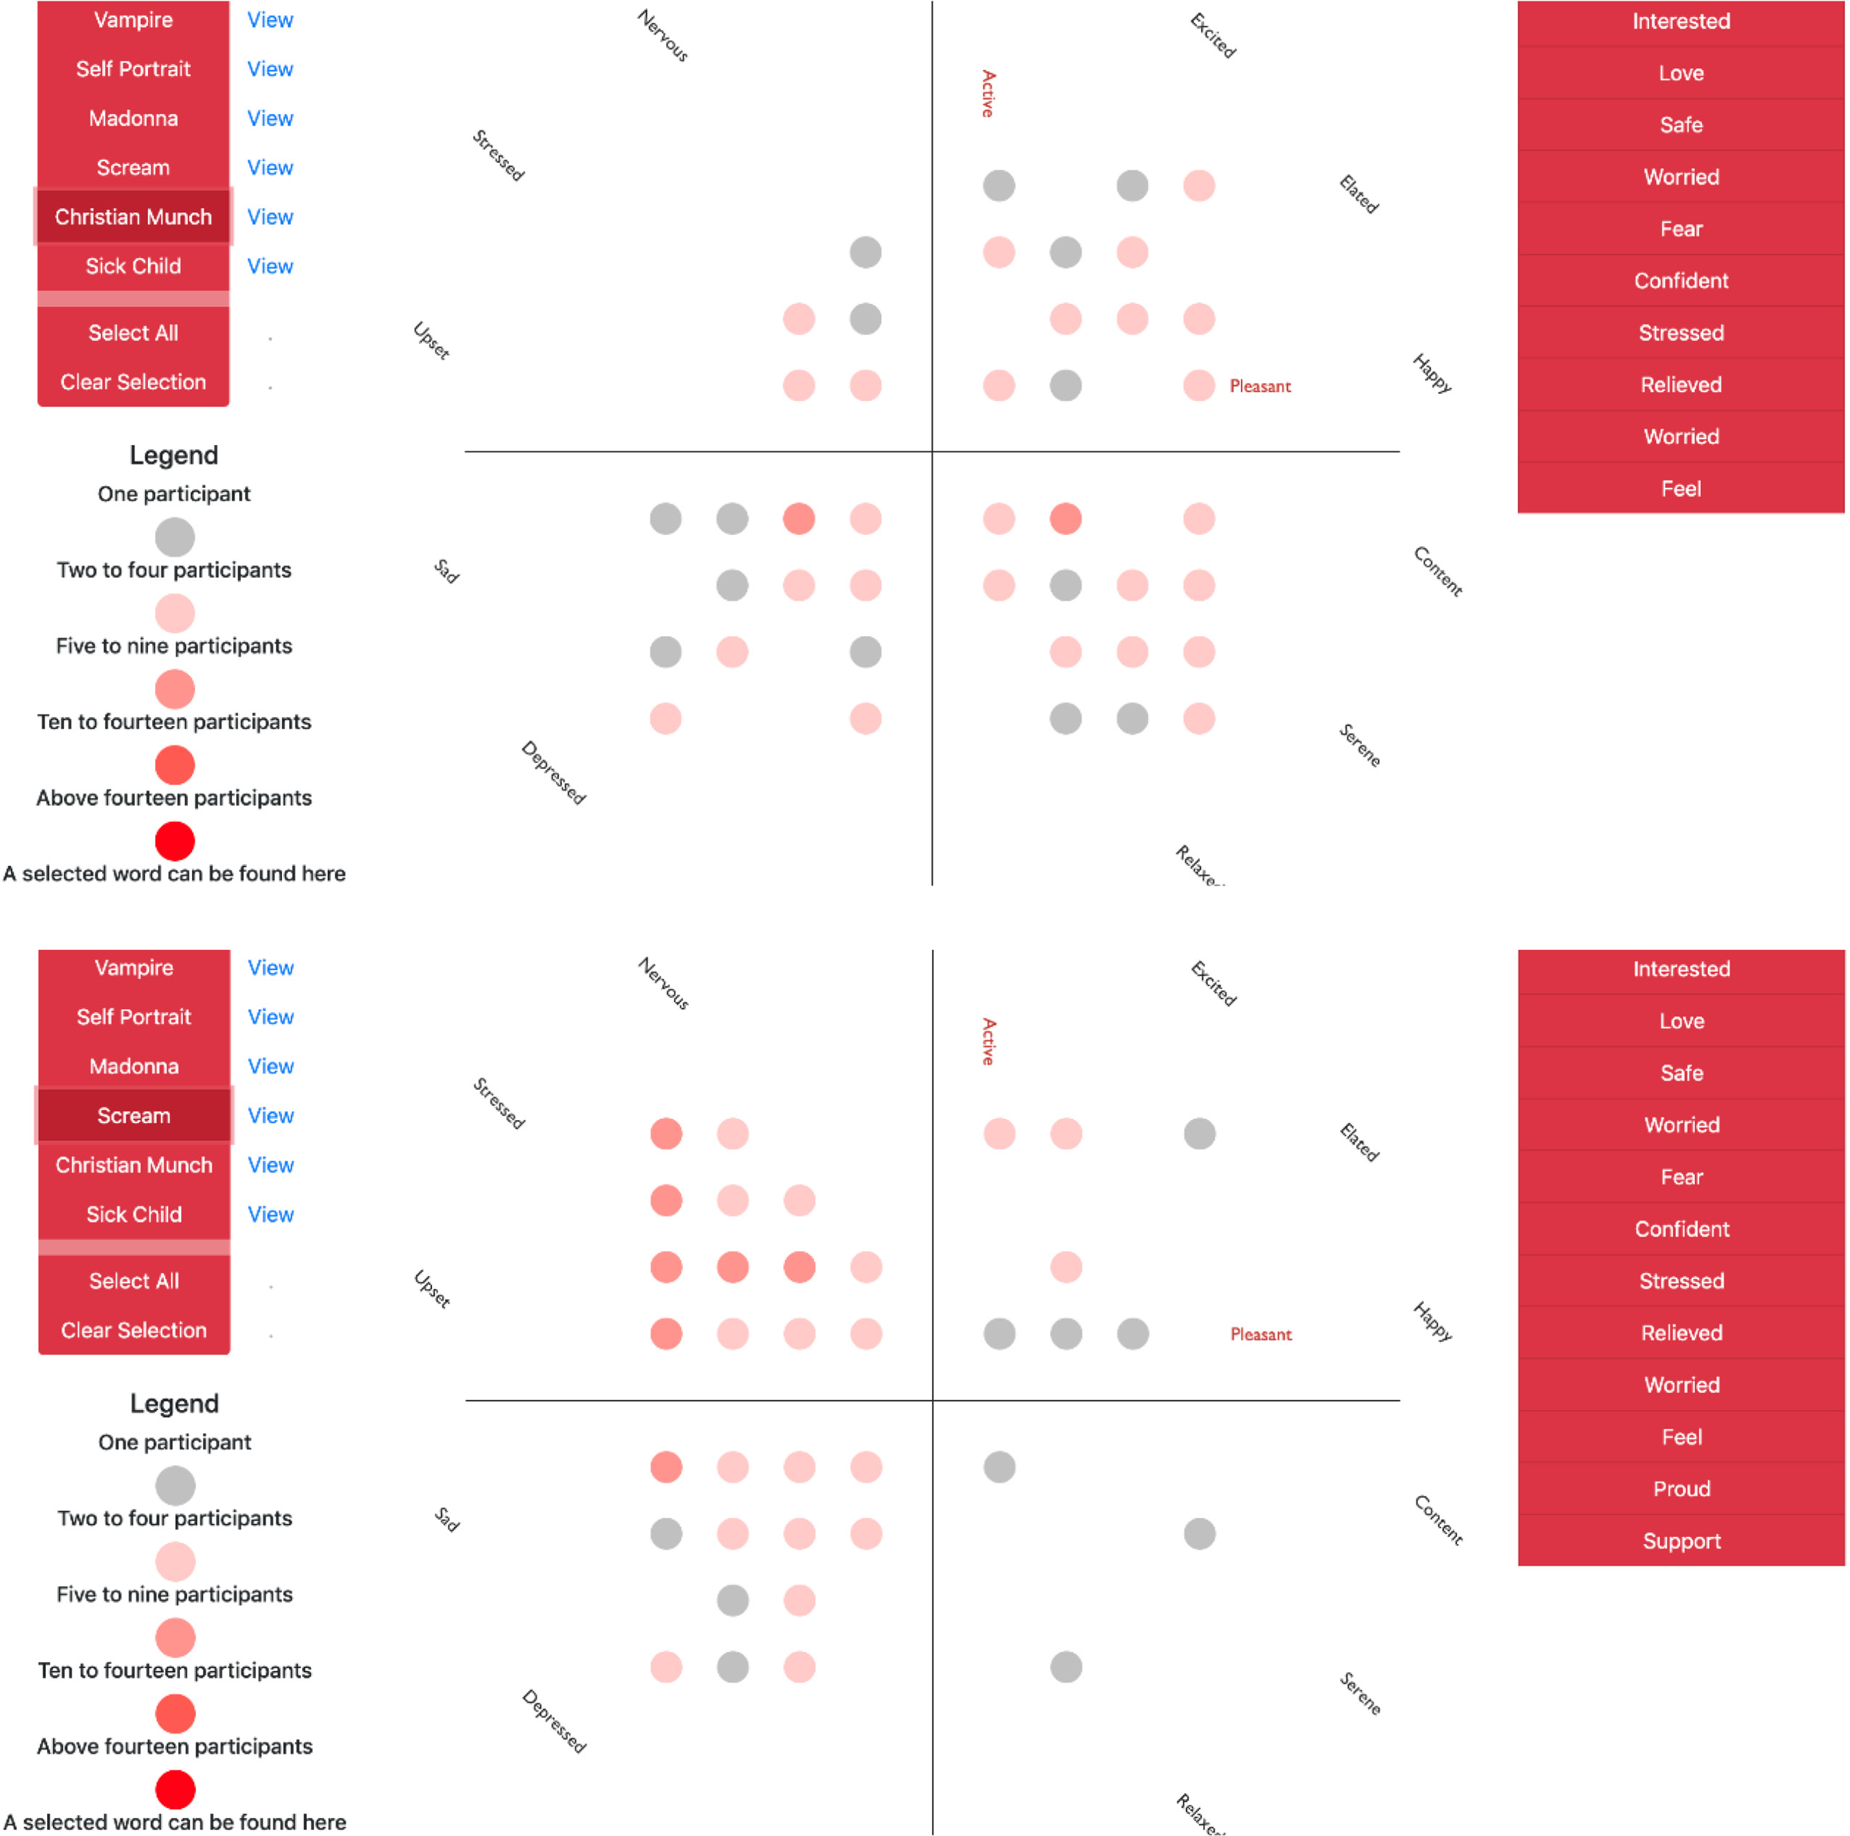
Fig. 9. (Top) Group visualization for Christian Munch in an Armchair. (Bottom) Group visualization for The Scream.
VisitorBox and Cardographer
Our final case study turns to using data to reflect on the design process behind museum experiences rather than on visitors’ behaviors. We developed a card-based tool, the VisitorBox Footnote 15 card deck, which was designed to engage diverse stakeholders in the design of interactive museum experiences (Huang et al., Reference Huang, Ng, Bedwell and Benford2020). The VisitorBox deck expresses in a set of cards a number of complex knowledge domains and processes relevant to the design and implementation of museum and galley visitor experiences, including curation, experience design, public engagement, mixed reality technology, and more. The five-stage process accompanying the deck structures a self-run, multi-person design workshop, engaging participants from identifying their problem space and relevant resources through to composing a custom design and testing it against several known challenges. VisitorBox guides even novice practitioners and stakeholders to co-create robust design ideas ready for implementation.
The Cardographer platform gives VisitorBox (and other compatible card-based design tools) a new, data-driven dimension. Cardographer was designed as a CSS (Gabriel et al., Reference Gabriel, Monticolo, Camargo and Bourgault2016; Wang and Nickerson, Reference Wang and Nickerson2017) to capture data about how design cards are used. Over time, this creates a repository of design data on which rich data analysis can be performed. Repositories can be institution-specific, accessible by a group of cooperating institutions, or even publicly available. As each card represents an aspect of a complex framework or process (Urquhart and Craigon, Reference Urquhart and Craigon2021), good analysis of how the cards are used can reveal how these aspects are considered by various museum stakeholders and applied in design. Knowing which cards are used most often in what combinations and by whom can also enable people using VisitorBox to reflect on their own design processes, which can be particularly useful to museum professionals unfamiliar with design practices. In this way, Cardographer builds on previous work that explored the potential of capturing and analysing data from a deck of Mixed Reality Game ideation cards (Darzentas et al., Reference Darzentas, Velt, Wetzel and Benford2019). The first function of Cardographer is to help capture data from the use of physical cards by using AR technology on a smartphone or similar to identify the presence of the cards during design sessions. It can also be used on virtual tabletops, where the data capture can be done from within the interface.
The second function is then to visualize the resulting data. For example, we captured data from 10 design workshops that collectively employed the VisitorBox cards to work up 59 different documented designs. An initial analysis revealed considerable variety between the various workshops and hence individual designs with regard to whether they followed and documented all of the stages of the VisitorBox process – only 11 designs fully documented all five stages. This reflects the ranges of possible complexities of the overall VisitorBox process and the time it can take to fully complete (which may not always fit a short workshop format) as well as the interests of the participants (some may wish to quickly proceed to ideation, while others may wish to take their time setting the scene first).
Simply counting the popularity of cards as used can yield some preliminary insights as to their stakeholders’ attitudes towards interactive technologies in museums. In this regard the VisitorBox deck acts as a survey tool to help reveal how users are currently thinking. Our data reveals which cards were used most. The following cards were used more than once and give an interesting picture of the needs and interests of the users and institutions as considered by participants:
• “Goals” cards reveal these users' top overall priorities as: New demographics (12 cards), Use assets in new ways (9), Visitor participation (9), and Change visitor attitudes of beliefs (8).
• “Motivations” cards reveal how our participants see visitors’ main motivations for engaging: Curiosity (13 cards), Stimulation (9), Social interaction (7), Academic interest (5), Aesthetic pleasure (5), and To make and do (5).
• “Barriers” cards reveal the top major barriers to digital technology adoption among this group of users: Irrelevant (17), Hidden (10), Overlooked groups (9), and Educationally disadvantaged (6).
We also explored how our dataset could be further inspected through two complementary visualizations. The first is the Cards Perspective, which gives an overview of all the cards in the deck and how they have been used, as shown in Figure 10. The Cards Perspective takes the form of a network graph, with each node representing an individual card, the size of which represents how many times this card has been used across all the designs in the dataset. The colors match those of the physical cards and convey the theme to which each belongs in the deck. Each link between two card nodes denotes the fact that they have co-occurred in the database, with the thickness of the link representing the frequency of these co-occurrences. The card nodes are positioned according to the density of these links. As a result, frequently used and co-occurring cards tend to appear near each other in the center of the visualization, while less frequently used ones appear towards the edge. Our visualization is interactive, supporting zooming and panning and also allowing users to easily select individual cards to show data about their use such as their connections to other cards.
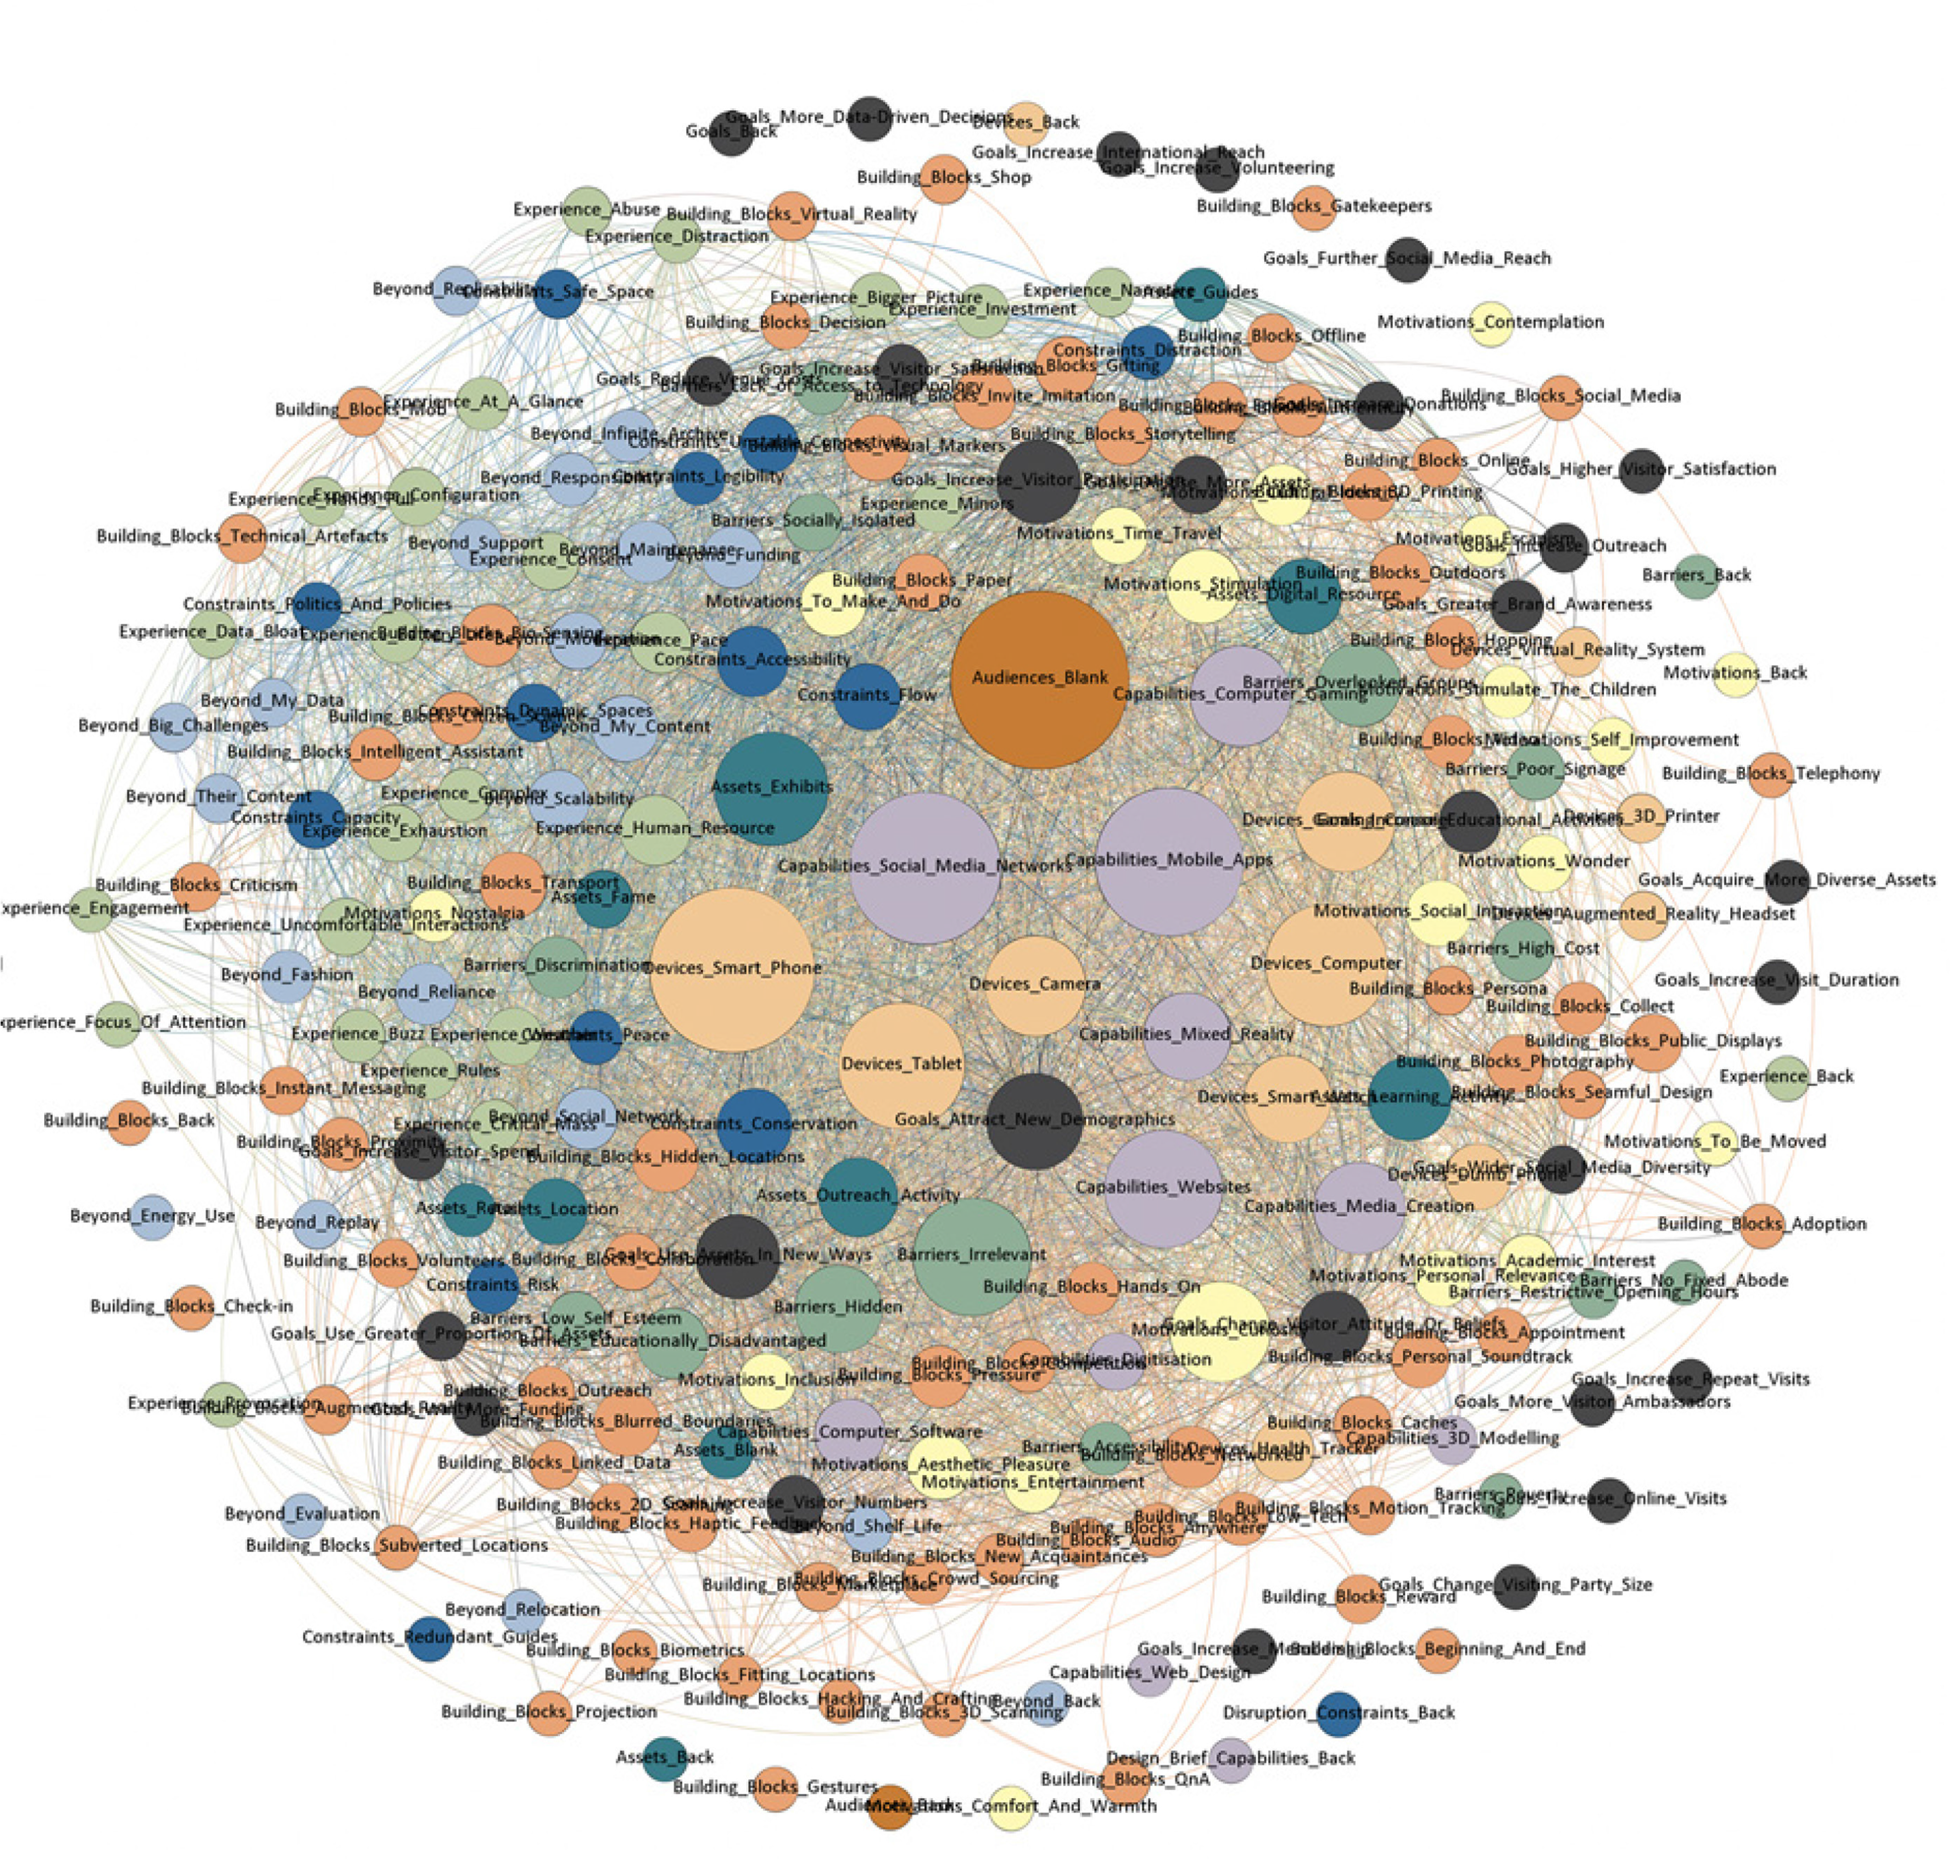
Fig. 10. The cards perspective.
The second visualization is the Designs Perspective, as shown in Figures 11 and 12 (left). The Designs Perspective (Fig. 11) shows all of the anonymized designs in the VisitorBox dataset. This is also a network-style graph. Each design that was generated using the cards is shown as a node, with the size representing the number of cards that were involved in generating this design – which can be an early indicator of their complexity. Two designs are linked if they share at least one card in common. The thickness of the link denotes the number of such shared cards. Again, the placement reveals the frequency of co-occurrence (i.e., popularity). Those that use many cards and/or share many in common tend to appear near the center. Those that employ relatively few distinct combinations of cards – which might be a clue as to potentially distinctive thinking – tend to lie toward the edge.
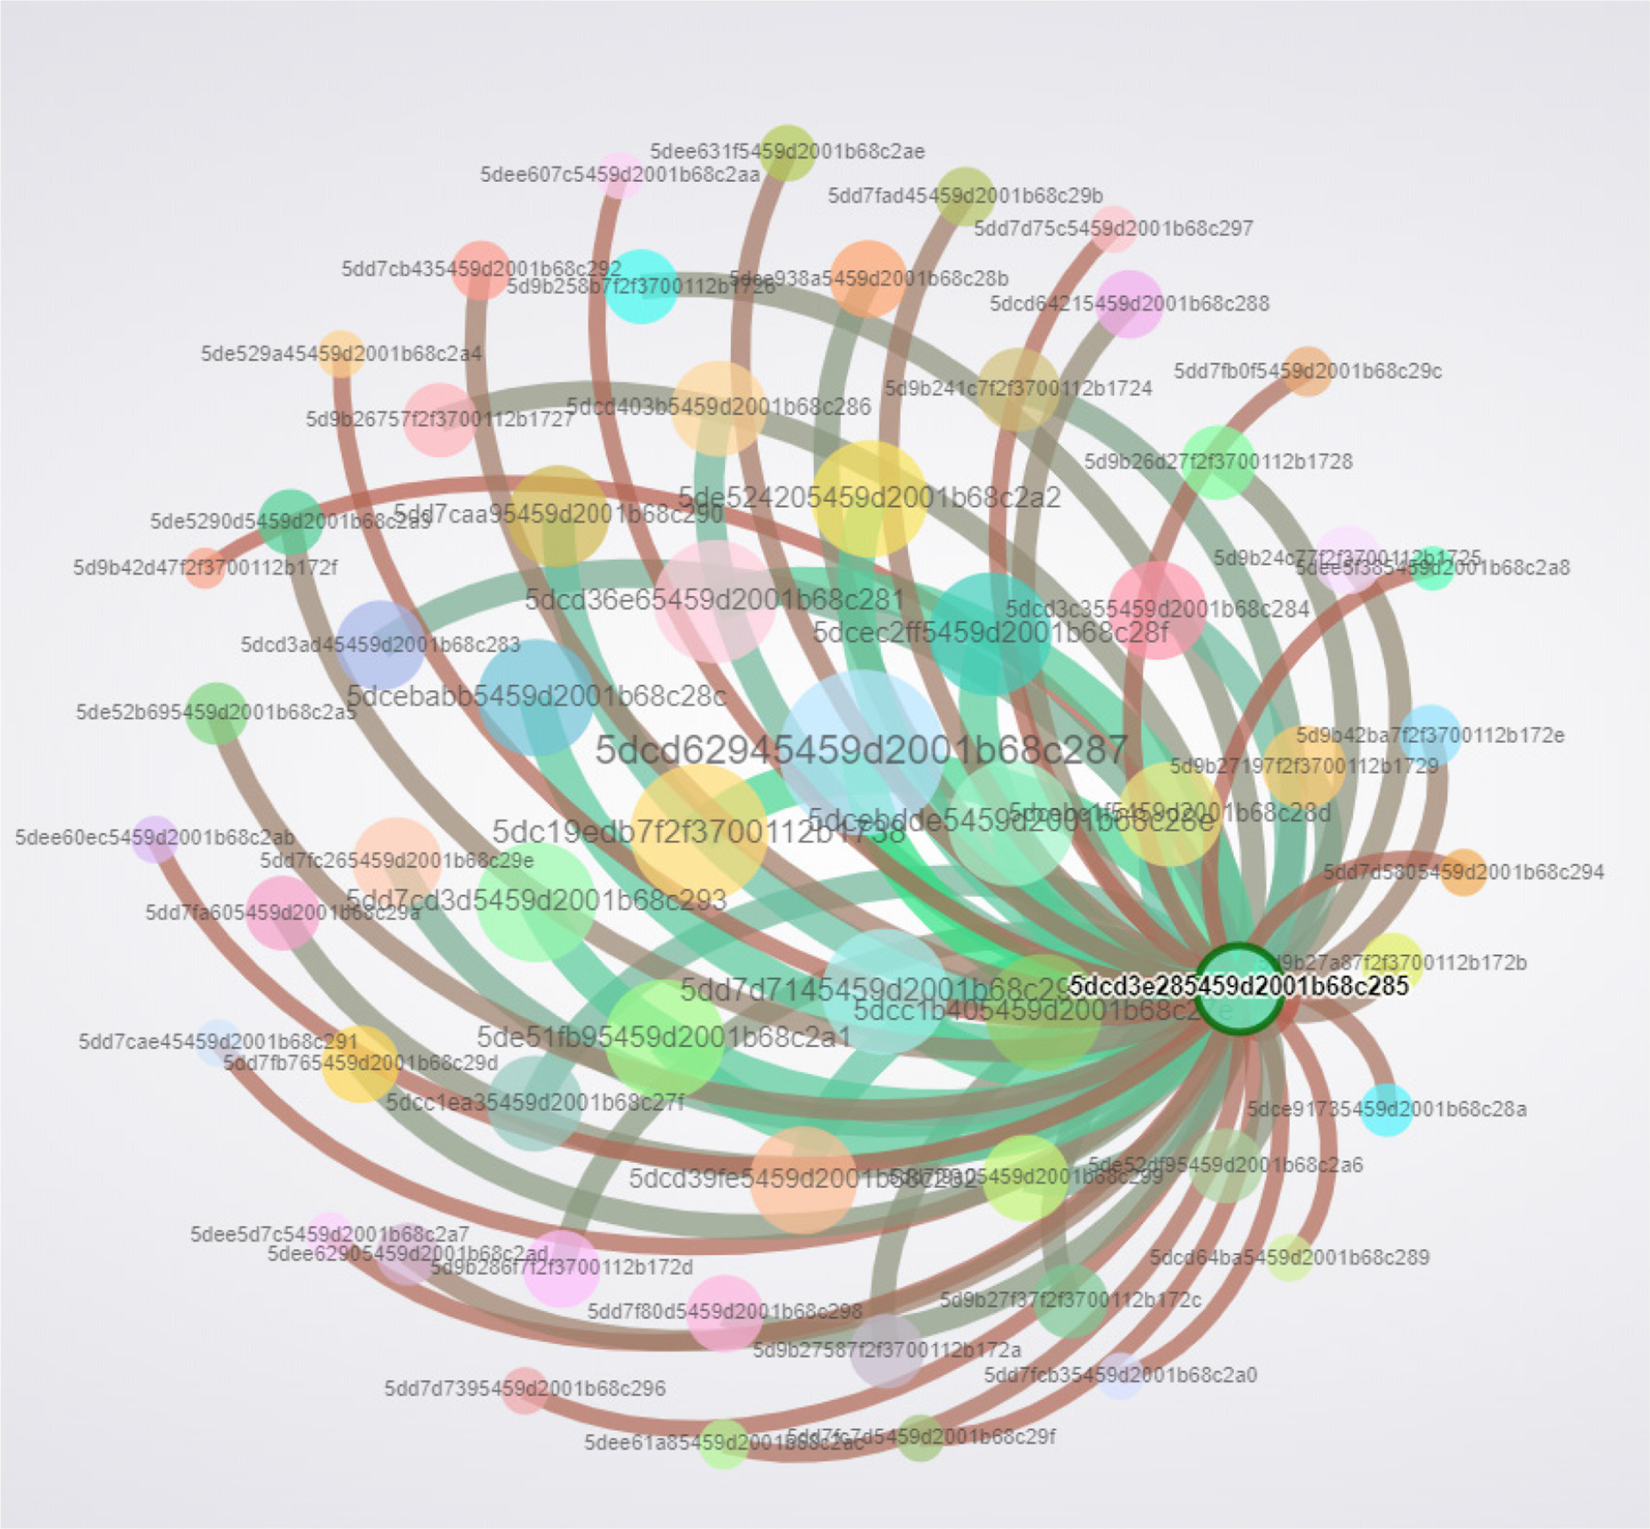
Fig. 11. The VisitorBox design space. Each node denotes an anonymized design that has been marked up using the deck.
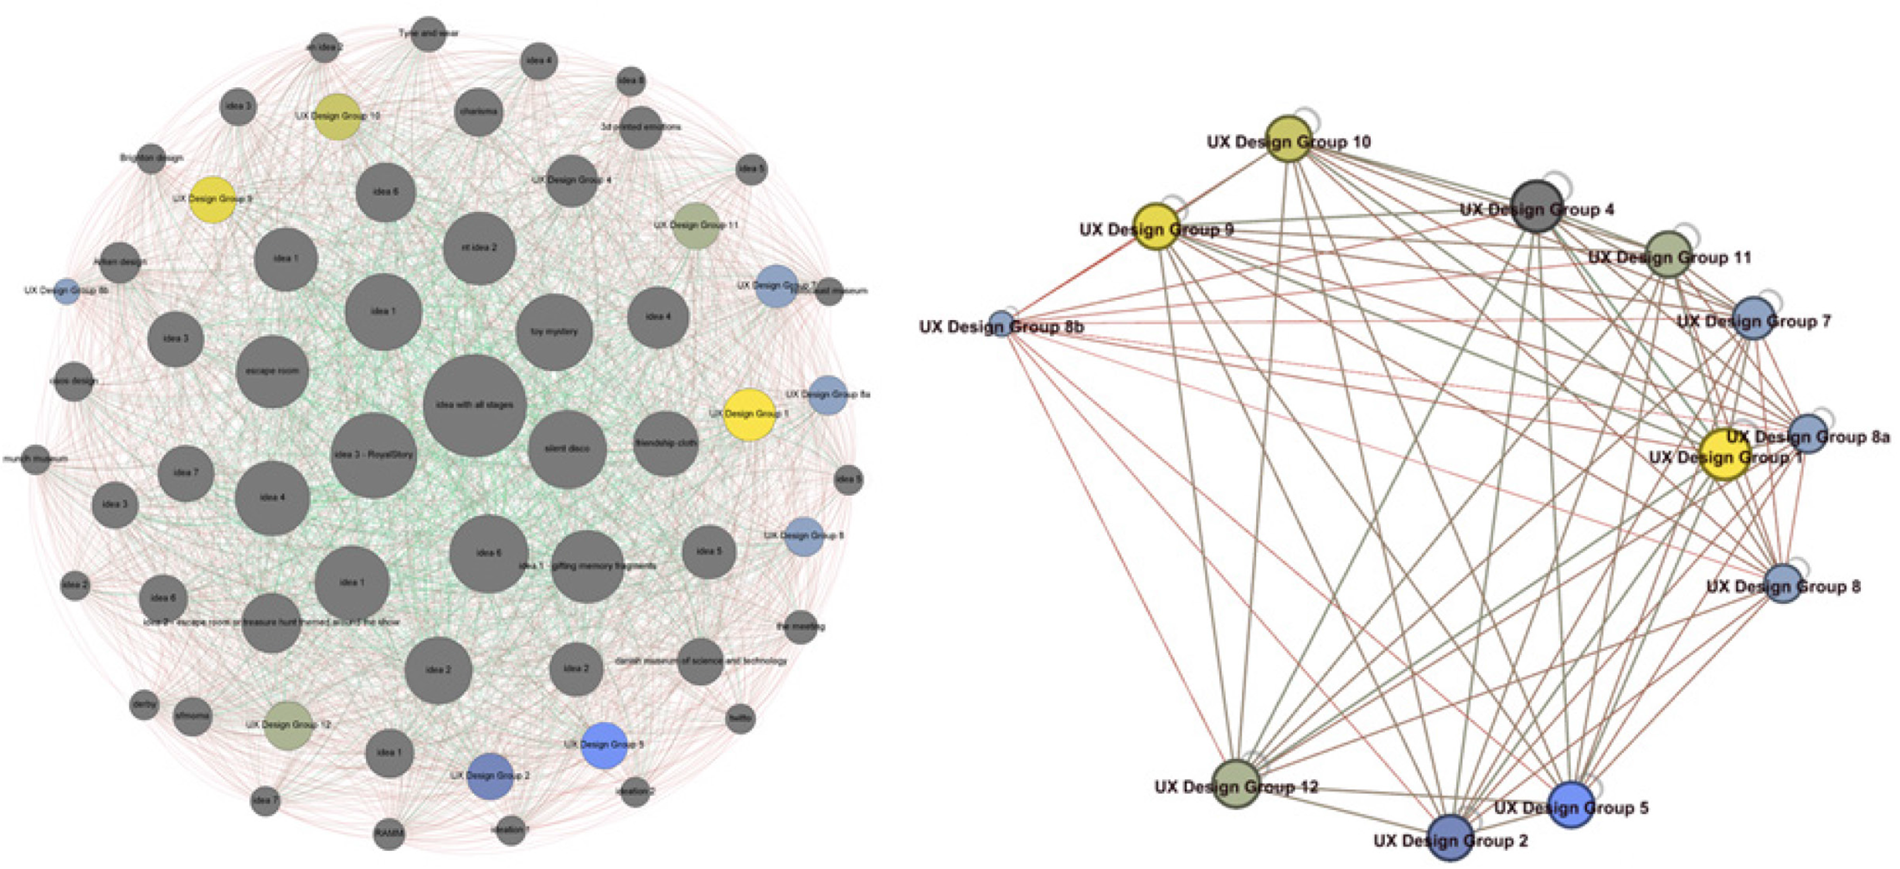
Fig. 12. (Left) The designs perspective with the ITU designs selected (Right).
Subsets of these designs will have been generated by a particular organization and/or as part of a particular design process, and it can be illuminating to compare their designs to the whole to see how this organization is positioned in terms of its priorities and strategies. The most detailed case we have of this to date is the use of the cards to teach master's students at the IT University of Copenhagen (ITU) seen in Figure 12, especially as each was graded by both the course convenor and an independent museum professional. Figure 12 (right) pulls out the ITU students’ designs from within all of the designs we captured to help understand their thinking relative to other designers we had encountered. On being shown the visualization, the course convenor was able to reflect that: “Groups 7, 8, 11 were variations over the same concept: Tinder-style, the user swipes left/right on a bunch of artworks to indicate preferences to be matched with personalised content,” while “Groups 2, 5 and 12 were all somewhat conventional designs (in my opinion), and not very original (though different from one another),” and “Groups 4 and 9 were also very similar designs (learning games about interpreting artworks for school students).” The course convenor could see how the overlap in the use of individual design cards could help inform and reinforce assessments of designs created by card users. Parallels in a professional context – beyond the validation given by the external museum professional who took part in the course assessment – include comparing the priorities of different groups of stakeholders in an organization, adjusting workshop length to create an optimal trade-off between thoroughness (complexity) of design process and value of completed design, determining stakeholders with particularly unusual and generative priorities, and identifying which designs are likely to be uncommon, or even novel. In fact, one identified strength of Cardographer is simply its ability to securely retain detailed, easily re-accessible information to remind users of where they left off in workshops that take place over multiple sessions! The combination of VisitorBox and Cardographer tools captures otherwise ephemeral data, provides context, and visualizes data to assess, inform, and potentially drive future design by museums and galleries.
Discussion
We now reflect across our portfolio of case studies to explore the various ways in which data can inspire design, how these opportunities can be embodied in collaborative processes among different stakeholders, and the challenges that arise in regard to data privacy, ownership, and transparency in GLAM contexts.
How data can inspire the design of museum experiences
Collectively, our case studies illustrate various uses of data with regard to inspiring design. To begin with, Thresholds was a hybrid virtual exhibit in itself, using a specially constructed place on which to map a virtual scene. Similarly, VRtefacts was a hybrid virtual exhibit on a much smaller scale, putting a single visitor into close proximity with one detailed physical object and one vitrine into which virtual images were placed. Thresholds and the Gift app utilized logged and implied movement data, respectively, to allow visualizations of visitor behaviors with their technologies as used in reconstructed or actual exhibition spaces as part of verifying and refining designs for these kinds of visiting experiences. VRtefacts and the Gift app are designed specifically to provoke visitors’ personal interpretations, then capture these interpretations as stories to be shared with others. The objects that are the subjects of these personal interpretations are “wrapped” in these unique new layers of data – with the Gift app offering the chance to unwrap multiple gifted objects, and VRtefacts wrapping its objects in multiple interpretations over time, forming a palimpsest of personal meanings that the object and its fact-based metadata would otherwise lack. Both the Gift app and VRtefacts offer not just the stories as shareable data, but also visualizations of connections to other people, other objects, and other stories. At first sight, Panopticon and Emotion Mapper appear to be concerned with profiling visitors (or exhibits) through capturing and analyzing data on their emotional responses to exhibits. However, our explorations reveal that their real potential may lie in exposing this data directly to visitors to provoke them to reflect on the meaning of exhibits and their own responses to them. Finally, Cardographer uses data from individual VisitorBox sessions at a “meta” level in the sense of provoking reflection on design thinking and generating future experiences. Aspects of VisitorBox could also support a fine-grained understanding of visitor engagement by using relevant cards to elicit visitors’ views as part of an iterative design process.
From even these brief, high-level observations, we propose that the diverse uses of data we describe serve to transform the relationship between the museum and its visitors in several ways:
• Understanding visitor engagement: Here, data is used to better understand how visitors relate to the wider museum, not only to market experiences to them but also to inform museums’ strategies and support their wider accountability to a range of stakeholders, including their own communities. This can be seen most clearly in Panopticon and Emotion Mapper, as well as in the premise behind VisitorBox and Cardographer.
• Delivering virtual exhibits: Here, data itself becomes a key part of new interactive experiences in the museum, including those that focus on virtually providing an experience of otherwise inaccessible artifacts, as in VRtefacts. Furthermore, the Gift app, Panopticon, and Emotion Mapper also use visitor-generated data to contribute to the experience such that the experience would not be the same, or simply would not exist, without their contributed data.
• Exploring personally meaningful data through wrapping: Here, digital data provides a “wrapping” for existing assets by attaching new meanings to them, especially personal meanings that complement received canonical interpretations and so meet the growing need to reflect a greater diversity of voices, as in VRtefacts and the Gift app. This data, whether viewed directly (as in a story captured by VRtefacts) or as a visualization (as in the multiple possible visualizations of Gift app data), can also reflect important information back to the institution regarding the layers of personal meaning that visitors have imbued their objects and collections with over time as stored in the digital data they have created to share with others.
• Provoking interpretation: A common feature of several of our examples lies in using data to provoke new interpretations, a key goal of many museums today. The revelation of visitors’ own personal data during the visit invites meaning-making, as seen in VRtefacts, the Gift app, Panopticon, and Emotion Mapper. The same premise underlies the reflective processes of Cardographer as used over time.
• Disrupting design thinking: Several of the examples in our portfolio disrupt elements of common museum design for interactive elements, such as the Gift app's rethinking of visitors in terms of their gifting activities rather than directly through intrusive observation or post hoc surveys. Thresholds places visitors in a replica of a photography exhibit that is artificial in every sense and yet genuinely recreates the shock of new technology (specifically, not just VR, but VR used in a custom-made substitutional reality room) that today's visitors could share with the long-dead visitors to the original exhibit. VRtefacts places visitors in the unfamiliar situation of being able to hold a huge, “real” historical aero engine or a small glass “frigger pipe” in their hands, and then being recorded while musing on their personal reflections. However, our disruption of design thinking per se is at its most powerful in the simple deck of cards augmented by data visualization tools. VisitorBox brings the potential to involve a wide variety of stakeholders in the design process, while the ability to reflect on card data from previous design sessions enabled by Cardographer can help provoke reflection and inform designs.
Of course, similar uses of data can be found in other sectors. Many companies seek to understand their customers’ engagement with their products, services, or institutions. Many seek to wrap traditional products in layers of digital information. Many deliver new kinds of interactive experiences. What is distinctive in our case studies are the specific ways in which we have seen data used to facilitate and inspire co-design for experiences in the GLAM sector, particularly museums and galleries.
First is the approach of interpersonalization (Eklund, Reference Eklund2020; Ryding et al., Reference Ryding, Spence, Løvlie and Benford2021). Many conventional uses of data, especially in recent years within the GLAM sector, are driven by a desire to personalize experiences. In contrast, our experiences involve the approach of interpersonalization in which visitors tailor experiences for each other, either indirectly, such as by sharing stories in VRtefacts, or directly, as in the overt interpersonalization of making a gift for another (Ryding et al., Reference Ryding, Spence, Løvlie and Benford2021) and so seeing the museum through their eyes (Spence et al., Reference Spence, Bedwell, Coleman and Løvlie2019). Interestingly, this involves the museum stepping back from its role of being the exclusive interpreter of artifacts to instead scaffold others in doing at least some of this interpretation for each other. In business terms, this places the focus on using data to support consumer-to-consumer (C2C) interactions rather than business-to-consumer (B2C) ones. This would constitute a significant change in mindset and skillset for professionals in many museums and galleries, who have been trained to “provide” for their visitors rather than think about how their visitors can provide interpretations, feedback, support, and design for each other. We elaborate on the last of these C2C interactions in the following sub-section.
Second is the use of visualization (Dove et al., Reference Dove, Jones, Dykes, Brown and Duffy2013). Several of our examples involve creating data visualizations rather than undertaking extensive data analysis. In large part, this may be because analysis is premature at this stage, and that manual inspection of exploratory visualizations is a useful first step toward understanding how such an analysis might proceed. However, we suggest visualizations are also suited to engaging museum visitors and have an aesthetic that suits display in the museum itself, for example on signage, tickets, brochures, and even as souvenirs, as in Emotion Mapper. Such use of visualizations can even be shared with visitors as a means of further provoking new interpretations and means of engagement with GLAM venues and their content. In short, visualizations can be an especially powerful way of inviting interpretation.
Third is the use of ambiguity. Previous research, drawing on the history of art as inspiration, has argued that ambiguity can be a powerful design resource (Gaver et al., Reference Gaver, Beaver and Benford2003) and can be deliberately used to provoke interpretation and meaning-making (Sengers and Gaver, Reference Sengers and Gaver2006). This can be ambiguity of information (which can mean making information overly precise as well as deliberately blurry), ambiguity of context, or ambiguity of relationship. Our case studies are rife with such ambiguities in their use of data. Emotion Mapper presents overly precise infographic interpretations of fuzzy emotional data. Thresholds provides an extraordinarily detailed and well-populated dataset regarding visitor attention to virtual artifacts and contexts within a physical exhibition space. Ambiguity of context appears in VRtefacts, which places equal value on the data provided by an offhand memory of a shirt worn on holiday, a marriage proposal, and new information leading to the identification of an object whose purpose and origins had until that moment been shrouded in mystery. The Gift app relies on an ambiguity of the relationship between visitors and the museum that raises questions of what it means to give an object you do not own as a gift, or perhaps the question of who owns the object anyway, which directly links to postcolonial perspectives on museums. In these examples, data is not used to give an answer, but rather to highlight ambiguities and invite questions and new interpretations.
How data inspires co-design
A key feature of our experiences is how data is shared between different stakeholders in the design process, with each contributing to and/or drawing on the data in different ways. We identify three broad classes of stakeholders that were involved in our examples.
Museum visitors, who form a more general “business” perspective, are the ultimate “consumers” of the experiences. They may contribute behavioral data (logs of interactions and/or measurements of emotional responses) or their personal or interpersonal interpretations (recordings of personal stories) and may benefit either indirectly from more interactive experiences or directly by seeing the data that they or others have contributed.
Curators are the “service providers” responsible for managing collections, making or scaffolding interpretations, and deploying new experiences within a given museum. They may benefit from greater insight into their visitors and experiences, from the availability of visitor-sourced content, or from others’ design ideas. They may contribute their own personal or alternative interpretations of exhibits or potentially data and make these available in the museum.
Installation designers are third parties who help design and realize new experiences (it is quite common to hire in such third parties in the museum sector) and were present in all of examples either as third-party design companies (e.g., in Thresholds, the Gift app) or in the form of our research team. They can benefit from new design insights, ideas from others, and potentially from comparing data across different museums. They contribute interactive experiences, ideas, and potentially wider knowledge of visitor behaviors from previous experience.
These three classes of stakeholders engage each other through various collaborative processes. The design literature has employed a variety of terms to describe how different stakeholders can collaborate in the design and/or experience of products, including the widely used concepts of co-design and co-creation. Co-design has been viewed as involving “customers” as participants in the design process (Steen, Reference Steen2013). Sanders and Stappers (Reference Sanders and Stappers2008) apply co-design to collaboration between trained designers and those not trained in design across the whole span of a design development process. In the case of museums, curators are the customers of installation designers, with both being trained in different aspects of visitor experience design, while visitors are the customers of curators and are generally untrained designers (Prahalad and Ramaswamy, Reference Prahalad and Ramaswamy2004). In the museum context, co-creation is broadly considered a process that involves user-generated content (Grabill et al., Reference Grabill, Pigg and Wittenauer2009), engaging visitors in creating new “memory materials” for collections, potentially alongside processes of co-collection that acquire existing materials from communities (Marselis, Reference Marselis2011), and often involving social media (Holdgaard and Klastrup, Reference Holdgaard and Klastrup2014).
A third concept at play in museums is co-interpretation, which involves users in ascribing meaning to materials in collections (Boehner et al., Reference Boehner, Sengers and Gay2005; Marselis, Reference Marselis2011; Eklund, Reference Eklund2020), typically by interpreting existing materials in new ways. In considering how museums support learning, Yuan (Reference Yuan and Richard2018) describes how co-interpretation may involve “interpersonal meaning-making in which learners' interpretative perspectives are influenced by their own experience and by interaction with the physical and social environment." Our case studies draw attention specifically to the use of data, as it may intersect with the meaning-making at play in co-interpretation.
Several authors point to the overlapping and sometimes interchangeable use of the above terms, especially of co-design and co-creation (e.g., Sanders and Stappers, Reference Sanders and Stappers2008). In an attempt to shed light on this confusion, Russo-Spena and Mele (Reference Russo Spena and Mele2012) articulate five Co-s which they position as being part of an overall process of co-creation: co-evaluation, co-design, co-test, co-launch, and co-ideation, with the latter referring to the involvement of customers in generating ideas for new products, which is directly mirrored in our VisitorBox and Cardographer examples.
Drawing on the literature and reflecting on our portfolio of case studies, Figure 13 presents an overarching framework for the data-inspired co-design of visiting experiences, intended to explain how our various stakeholders engaged in different collaborative processes. We adopt the position that overall, stakeholders collaborate in extended co-design processes that range from early design ideation to real-world deployment and involve the generation of design ideas, content for collections, and interpretations. Our framework reveals how our stakeholders engaged in three specific processes as part of co-design (though we note that not every example involved all three processes, and that other processes could come into play in other examples, such as co-collection and co-evaluation).
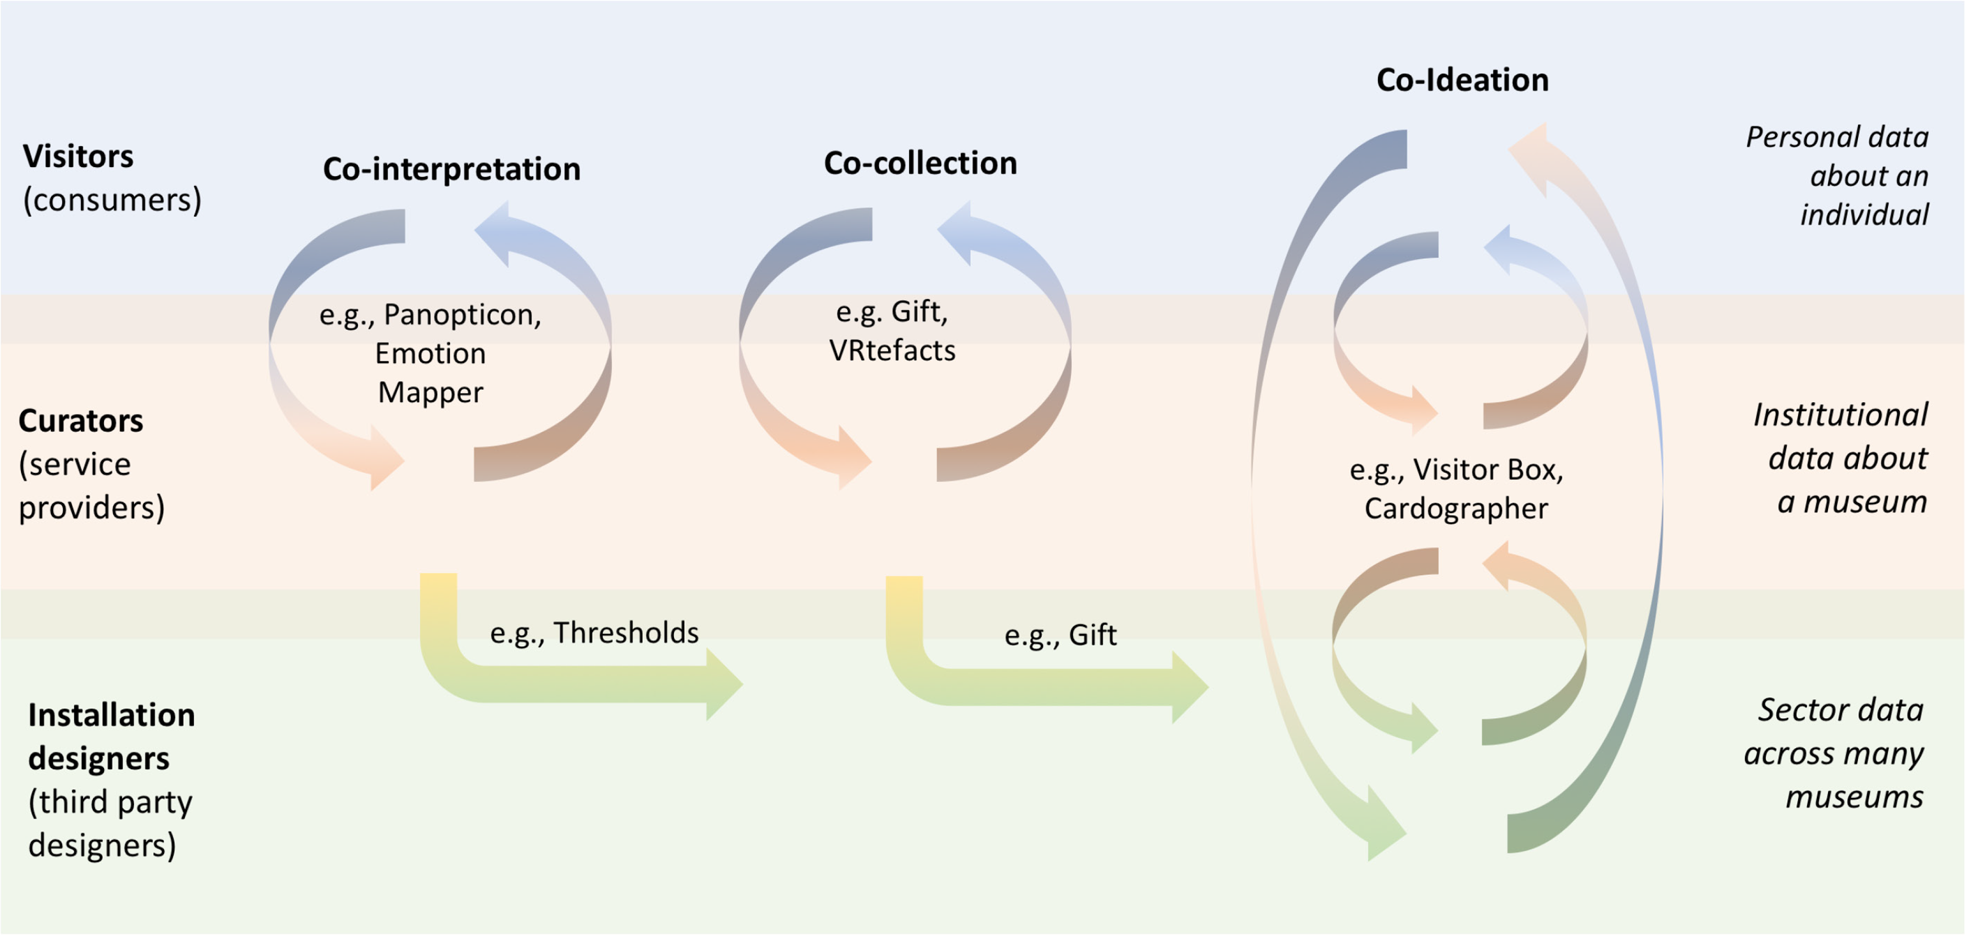
Fig. 13. A framework for data-inspired co-design in museums.
Co-interpretation refers to a relationship between visitors and curators in which data inspires new interpretations by both parties. It is about making new meanings from data. Examples of this from our portfolio are Panopticon and Emotion Mapper, which both use data to engage visitors with their own emotional responses to exhibits as a way of provoking reflection and meaning-making.
Co-creation is reserved for engaging visitors in generating data as new material for museums’ collections. In particular, we align with Marselis's (Reference Marselis2011) view of co-creation in museums as being about the visitor generating the “primary” content of the experience. The Gift app and VRtefacts provide clear examples, with both directly capturing visitors’ own personal stories with the intent of sharing them with others; with a general audience in the case of VRtefacts; and with specific individuals in the case of the Gift app.
Co-ideation refers to engaging visitors in the generation of ideas at the early stages of designing visitor experiences and typically involves framing their engagement as one of “being designers” (whereas their role as designers may be more implicit in co-creation and co-interpretation). This process is embodied in our VisitorBox and associated Cardographer examples.
Figure 13 also shows how co-interpretation, co-creation, and co-ideation operate as a series of loops in the case studies from our portfolio. The figure also shows other indirect, less immediately collaborative, and possibly more traditional uses of data to inspire design, most notably feeding data captured from the ongoing use of exhibits back into the design process as we saw with Thresholds, where system logs of visitor behavior helped refine the experience, but without feeding this back to visitors themselves. We propose that, while these processes and hence loops may interleave (e.g., visitors might be involved in a broad co-design process that includes co-creation and co-design, while co-creation may often overlap with co-interpretation), it is useful to recognize them as being distinctive in terms of how their loops operate and how they are framed for visitors. In other words, it is important to consider what visitors see themselves doing, and the consequent implications for the challenges of privacy, ownership, and transparency, as we will now discuss.
Negotiating the challenges of data-inspired co-design
Data-inspired design is not a “free lunch,” as the use of visitors’ personal data in the ways discussed here raises significant challenges as well as opportunities. The three that we explore below are well known in the wider context of personal data use by Internet services, including social media, but have particular resonances in the context of museums that need to be carefully considered.
Privacy
The privacy of personal data on the Internet is a widely discussed issue, having been raised into the public consciousness by various episodes of technical and ethical data breaches and apparent misuses of data without consent, notably the Facebook-Cambridge Analytica scandalFootnote 16 that surfaced in 2018 (Isaak and Hanna, Reference Isaak and Hanna2018). Consequently, many organizations, including museums, are increasingly aware of the need to comply with relevant legislation such as the General Data Protection Regulation (GDPR)Footnote 17 (de Hert and Papakonstantinou, Reference de Hert and Papakonstantinou2016; Tikkinen-Piri et al., Reference Tikkinen-Piri, Rohunen and Markkula2018) alongside best practices in cybersecurity (Toch et al., Reference Toch, Bettini, Shmueli and Lepri2018) despite often being under-resourced to handle such issues. One response has been the idea of privacy by design, which has established principles for guiding fair information practices in system design including notice, choice and consent, proximity and locality, anonymity and pseudonymity, security, and access and recourse (Langheinrich, Reference Langheinrich, Abowd, Brumitt and Shafer2001).
The case studies in the portfolio negotiated these principles. In trying to establish what the designers considered “fair data use,” the Gift app notified visitors of data capture, asked for consent, and drew a distinction between the content of personal stories made for others – which were not made available for wider use (e.g., not even by the research team) – versus metadata showing the patterns of exchange that were used in a pseudonymous form to generate the visualizations reported earlier. Even then, challenges emerged. For example, it may be possible to identify individuals from patterns of gift exchange alone if the gifted artifacts are not themselves anonymized. Imagine user A used the Gift app and received artifact X from user B. If the visualization shows that X was only ever given by one person, but that user B gave artifact X as a gift to many people, A could then work out who B was and that their gift was not unique to them. Therefore, open sharing of even anonymous data can be a risk to privacy, and the full dataset was not shared openly. Panopticon was also designed according to the principles of privacy by design by making clear to the users when any data capture took place, giving them physical control and ownership of it, and initiating a dialogue about its value to them as personal data and to the host venue as data they could use for organizational purposes. As the visitors’ interactions were only with the host institution and not with friends in the sometimes socially fraught context of gifting, there was a far lower, though non-zero, risk of anonymous data losing its anonymity if widely shared.
We propose that the fair use of data should involve delivering proportional benefit to visitors in terms of an enhanced experience, for example enabling interactivity (Thresholds), inviting deeper interpretation (Panopticon, VRtefacts, Emotion Mapper, and the Gift app), creating a more interpersonal and/or social experience (the Gift app), or by giving visitors a voice as stakeholders in design (VisitorBox and Cardographer). Moreover, we propose that visitors might be exposed to their own data so they can understand what has been captured and reflect on it. Also, provided that it does not compromise the proportional benefit, they might share their data with others. The idea of “data souvenirs” (Petrelli et al., Reference Petrelli, Marshall, O'Brien, McEntaggart and Gwilt2017) in which a visitors’ data is transformed into a souvenir of their visit would seem to be a promising approach that would suit experiences such as Panopticon and Emotion Mapper, whose emotional data might be further transformed into a variety of aesthetic and engaging forms. More generally, it is important to recognize that the co-interpretation, co-creation, and co-design processes shown in Figure 13 all involve designing “loops” in which there should be a direct, immediate, and proportional benefit to visitors in return for the use of their data. It is necessary to carefully consider the “feedback” part of these loops in each instance – what benefit the visitor receives and how they might safely experience their own data.
Ownership and rights
Our second challenge relates to ownership and rights to use with respect to both personal data generated by experiences and preexisting artifacts and exhibits. Co-creation brings with it the question of co-ownership – who has the right to use what has been jointly created and what credit or other reward accrues? This has also been a contentious issue for Internet and social media technologies, reflected in longstanding debates about copyright and image rights as part of what has been termed “remix” culture (Lessig, Reference Lessig2008). For personal data, this means understanding how the museum is subsequently allowed to re-use and re-publish personal data, from overtly generated stories to implicitly captured behavioral data. In the case of VRtefacts, stories are generated to be retold to subsequent, unknown, visitors. (Visitors are asked for consent before and after recording to ensure a full understanding of their data rights, and they can withdraw the museum's right to share their story at any time in the future, just as with a research project.) In the case of the Gift app, content is explicitly intended to be shared with identified receivers, but probably no further, though there might be potential interest in publishing some more widely as inspirational examples. In such cases, people may want to be recognized for their contributions, or it may be important to do so to properly contextualize their stories.
Conversely, in what ways are visitors free to reuse their data, including images and videos captured of artifacts within the museum? Museums will have different policies about image rights in their exhibits (e.g., between an art museum and a museum of antiquities) and more generally whether photo and video capture are permitted or encouraged. The Gift app explicitly instructs visitors to refrain from capturing images in galleries where photography is not permitted, but this instruction is easily forgotten. Similar practices and drawbacks are also implicit in our other experiences. The data visualizations generated by Emotion Mapper may best be interpreted with reference to images of the original artworks. Driven by perspectives from post-colonial studies, many museums are already sensitive about misappropriating other cultures’ artifacts. Such sensitivities will be heightened when visitors are then invited to appropriate them for themselves, especially as part of activities that could – even if not the intention – be seen to trivialize them, for example making a personal gift of them (Ryding et al., Reference Ryding, Spence, Løvlie and Benford2021). Tensions stemming from divergence between the Global North and the Global South are likely to continue, as the response to COVID-19 and any future global pandemics so obviously favors the wealthier nations, who historically tend to be the ones holding the artifacts of the less wealthy. This is especially true as personal health data becomes increasingly valuable to states seeking to control the spread of the pandemic, using methods that do not always place the same value on transparency, rights, and privacy that we advocate in this paper. If people become (increasingly) mistrustful of the ways in which their personal data can be used by larger institutions, simple design choices by museums associated with authority may face even stronger backlash than has been seen to date.
Museums’ responses to this challenge are likely to vary according to their specific situation. This said, we briefly highlight one potential approach that may fit well with the general culture of the sector. Donation of various kinds, from artifacts to money, is a familiar and important practice for museums, being a source of funding and sometimes also of exhibits. Indeed, many museums have been established around donated collections. Might the transfer of personal data as part of co-interpretation, co-creation, or co-design be treated as a form of donation, with appropriate rights to use and crediting – from anonymous to sponsored?
Transparency
Our final challenge concerns transparency, which is predicated on the knotty issue of truthfulness. This is a debate that has recently come to the fore on the Internet, and especially social media, with extensive debates around “fake news,” freedom, and the need, or not, for regulation and protection from online harms (Flintham et al., Reference Flintham, Karner, Bachour, Creswick, Gupta and Moran2018). Of course, transparency is also a fundamental concern for museums who are faced with the challenges of broadening perspectives on truth from conventional “received” views of history that privilege certain perspectives to instead reflect a wider variety of truths, while at the same time dealing with what might be seen as offensive views, from overt hate speech through to possibly naïve but well-intentioned attempts to save people's lives, such as warning them of the dangers of the purported magnetic properties of COVID-19 vaccines. In short, both social media and museums face the same broad challenge, though again with different specific concerns which may then clash when experiences bring the two together. What personal stories should visitors be able to tell through the Gift app, for example, or through their reflections on their emotion data, and how widely should these be known?
In dealing with this challenge, designers might want to consider the different spaces in which data might appear and to what extent these are seen as being inside or outside the museum. Placing data on the walls of the museum, both its physical walls and perhaps its website and social media channels, might suggest it has been curated. If a museum is associated with data that appears in other public spaces beyond the museum itself, for example on other social media, this might imply complicity or at least a degree of (ir)responsibility for what is said. Should and can museums control what appears on people's personal devices such as their smartphones? And can museums, who are often operating on stretched budgets, afford the effort taken to moderate such content? Above all, in the context of museums and galleries, “truth” is rarely a singular, uncontested fact, as any of the theoretical works cited above will quickly show. However, data can be treated with full transparency: how it was obtained, when, by whom, and to what end. Out of such transparency, there is at least the potential for a shared understanding of the various truths that may emerge.
Conclusions
Museums and other GLAM sector institutions are illuminating and richly complicated contexts in which to explore how data can inspire design, promote richly collaborative processes, and address challenges around data use. Through an RTD approach, we have established a portfolio of visitor experiences that were deployed and studied in museums over a period of 3 years, each employing visitors’ data in a distinct way to provoke new ways of designing and interpreting exhibits. Reflecting across our portfolio revealed both opportunities and challenges for data-inspired design. In terms of opportunities, data captured from our visitors was used to guide them to new experiences and enable insights in audiences, wrap existing artifacts and exhibits in new layers of meaning, deliver new virtual and hybrid exhibits, provoke interpretation, and productively disrupt design thinking. We also saw how these opportunities involved the use of ambiguity, visualization, and inter-personalization. In terms of challenges, we saw how designers need to wrestle the complexities of privacy, ownership/rights, and transparency that are well-known concerns on the Internet at large but have strong resonances with the agendas of many museums. We noted how our examples involved three distinct kinds of design loop – co-interpretation, co-creation, and co-design – each of which draws on visitors’ data but also feeds it back to visitors to provide direct benefits to them as part of balancing the above opportunities and challenges. Based on these insights, we draw out the following wider implications or data-inspired design:
• Those engaging in data-inspired design should explicitly consider which kind of design loop they wish to support and the opportunities and challenges it raises for using visitors’ data.
• They should also be sensitive to the contexts for which they are designing. Museums have distinctive agendas, both collectively and individually, that directly impact on how data might be used (or not).
• They should design loops that directly engage visitors with their own data, encouraging them to be aware of its use, reflect on it, and through this form new interpretations to ensure that visitors benefit as well as museums and designers.
We have focused on the museum sector as a particular, perhaps even peculiar, context for data-inspired design, which naturally raises the question of how our insights might apply in other sectors. This is a question for further research, by us and others, but we note that the wider opportunities and challenges we identified are likely to occur in other settings, although perhaps with different balances of concerns. The need to recognize the distinction between co-interpretation, co-creation, and co-design seems likely to be of wider relevance, as does the potential to design loops that more directly engage consumers with their own data rather than solely reserving it for hidden use by designers and service providers. Museums foreground the question of how consumers as well as providers create data that, we suggest, might potentially benefit other sectors, from health and well-being, where people may reflect in their own personal data, to consumer goods, where everyday products may be combined with personal data in a variety of presentations or visualizations that market them, guide their use, or transform them into “experiences.” And, as with any data, the types examined here highlight interesting possibilities for use within social media which are already deeply involved in co-creation using personal data.
We close by turning to the matter of AI, which is widely seen by many as playing a potentially important role in the “smarter” design of all manner of products and services. Our paper is not about the use of AI per se – it does not feature examples of applying machine learning to data, or expert systems, agents, or other forms of automated support for designing a creativity. However, what it does do is focus on the data that will underpin such AI. We hope that our paper has revealed something of the rich landscape of human data use within which future AI might operate. If AI is to support design – at least speaking of the museum sector – it will need to recognize the wide role that data can play in design and the sensitivities around this. We foresee potential opportunities for AI far beyond its conventional use for profiling visitors to enable the personalization that has been the focus of much research to date. Rather, AI might take a role in assisting interpretation and ideation and in explaining or even provoking humans to new insights in the frame of CSSs (Gabriel et al., Reference Gabriel, Monticolo, Camargo and Bourgault2016; Wang and Nickerson, Reference Wang and Nickerson2017). However, to achieve this, AI also has to negotiate the complexities of privacy, ownership/rights, and transparency, important human concerns that arise when publicly visible and valuable institutions engage with people and their data.
Acknowledgements
The work was supported by the EU's Horizon 2020 research and innovation program under grant 727040 and received support from the EPSRC Horizon: Trusted Data-Driven Products grant (EP/T022493/1), and the EPSRC Centre for Doctoral Training in Horizon: Creating Our Lives in Data grant (EP/S023305/1).
Conflict of interest
The authors declare none.
Dimitrios Darzentas is a multidisciplinary Research Fellow in the Mixed Reality Lab of the University of Nottingham. His work is situated at an intersection between HCI and Design with a broad scope including Mixed Reality Technologies, MXR Storytelling and Cultural Heritage, Physical/Digital Service Design, and Playful Interactions, among others. His current research focus explores Data-Supported Creativity and Design Documentation approaches that utilize card-based (and other) tools to capture rich insights into design thinking and processes to develop data-inspired design knowledge without compromising innovative creativity.
Harriet Cameron is a PhD student in the Horizon CDT at the University of Nottingham, working as part of the Mixed Reality Lab. Her works focus on the use of personal data in museums and galleries – fostering transparency and mutuality through data collection practices. Her research interests span HCI and Human Geography to explore culture, identity, place, space, and technology.
Hanne Wagner is a Research Fellow in the Mixed Reality Lab and the Horizon Research Institute for the Digital Economy at the University of Nottingham. Her work combines elements of social sciences, psychology, game studies, and HCI. A particular interest of hers is matters of (political) engagement and policy. Other current research activities consider issues of well-being during the onset of dementia, trust in autonomous systems, and using card-based tools for creativity, analytic, and planning purposes.
Peter Craigon is a Research Fellow in Ethics Legislation and Engagement in Agricultural and Food Innovation at the Future Food Beacon of Excellence at the University of Nottingham. His current work focuses on developing methods, particularly card-based tools to enable technologists and researchers to engage with and reflect on the ethics of their work, to help them work toward the goal of “ethics by design.” One of his research interests is how data can be captured through the development and use of such tools to provide insight into the pragmatic engagement with ethics in practice and wider issues relating to Responsible Research and Innovation in particular the societal desirability of research and innovation.
Edgar Bodiaj is a Research Associate and Developer at the Mixed Reality Lab. He has a background in Computer Science and is currently involved with projects focusing on user interaction and engagement inside Virtual Reality. His research interest includes VR experiences, Data VisualiZation, and Novel Online Communication.
Jocelyn Spence is an Interaction Design Researcher at the Mixed Reality Lab. She works primarily in the context of Performative Experience Design, especially everyday and/or storytelling performance, in mixed reality contexts, including augmented and virtual reality. Her research interests also include digital and hybrid gifting, design fiction, embodied and sonic interactions, and cultural heritage.
Paul Tennent is an Assistant Professor of Computer Science at the University of Nottingham. His work focusses on situated performative mixed reality, with a focus on cultural experiences from theatre, to museums to games. His work is typically practice-led working with artists and creatives to push the boundaries of immersive technologies.
Steve Benford is the Dunford Professor of Computer Science in the Mixed Reality Laboratory at the University of Nottingham, where he directs the Horizon Centre or Doctoral Training and the Smart Products research beacon. He previously held an EPSRC Dream Fellowship, has been a Visiting Professor at the BBC, and was elected to the CHI Academy in 2012.


 Open access