


Introduction
In April 1981 the author was asked to supervise the commissioning of a self-contained portable sea-ice research laboratory and to evaluate its performance under Arctic conditions. It was constructed for the Department of Fisheries and Oceans Canada, and the Arctic Research Establishment (ARE) of Pond Inlet was given responsibility for operating and maintaining it. The laboratory was installed, complete with power plant and refrigeration/heating system, on top of the frozen sea ice in Eclipse Sound, near Pond Inlet, about 0.5 km from shore.
A non-commercial small test machine (the smallest known to the author) stored at ARE in Pond Inlet was used for strength measurements of ice (Reference FinkeFinke 1972). It was driven by a battery-operated motor with nominal capacity of 10 kN, but the original load cell and displacement gauges were not available.
The decision to conduct this series of tests was taken primarily because of the author's interest in the effect of system stiffness on strength measurements of ice (Reference SinhaSinha 1982[a]). Previous testing with the machine had not been adequate to evaluate it. Results (Reference FinkeFinke 1972, Kohnen 1976) showed that most of the samples used previously were vertically oriented. No information on the time aspects of previous tests was given; moreover, there were no data on the stress/strain relation of horizontally-oriented samples.
Two sites in Eclipse Sound (Fig.l) were chosen for sampling: station 1 was about 0.5 km from the shore and station 2 was almost in the middle of the channel, about 7.5 km from shore. Growth conditions at both sites were carefully monitored throughout the growth season at intervals of about two weeks using methods already described (Nakawo and Reference SinhaSinha 1981, Sinha and Reference Nakawo and SinhaNakawo 1981). The ice cover was quite uniform and vertical variation in salinity was similar at both sites (Fig.2.). The ice was columnar-grained at both stations, with the c-axis of the grains tending to be in the horizontal plane except for about 2 cm at the top. At station 2 the c-axis of the grains tended to be parallel to the axis of the channel and the current, and hence similar to the ice observed by weeks and Gow (1978, 1980). This anisotropy in the texture of the ice could be seen very readily (Fig.3.).
Experimental Procedure
Preliminary observations revealed that the driving motor of the test machine could not produce a load of more than about 9 kN even when the battery (12 V) was fully charged and warm; this capacity decreased considerably when the battery was cold. As electricity was available through the generator, an insulated, heated box was made for the battery. A more serious problem was the inability of the system to maintain a constant displacement rate between the top and bottom steel platens during loading. Although this displacement rate × could be varied continuously, the actual rate at a chosen speed decreased gradually with load increase. This could be seen on a current meter and detected in the changing tone of the motor.
Five speed settings were chosen and marked on the speed selector dial. The experiments were then conducted in a quasi closed-loop mode, i.e. speed was maintained at a constant level by manually controlling the rate of displacement to generate a constant tone. This procedure did not, however, work well at high loads.
All the experiments were conducted on freshly sampled ice, usually within a few hours of sampling. Vertical cores were obtained with a core auger of 76 mm diameter and horizontally oriented blocks with a chain saw. Prismatic samples were then prepared with a band saw at -10°C and the surfaces were finished manually with fine sandpaper on a flat surface. Only samples that did not vary in any dimension by more than about 0,1 mm were accepted. The top and bottom end surfaces were given a mirror finish by bringing them into contact with a small glass plate (used for thin sections) warmed previously by a hot plate at about +5°C. This process removed, without excessive melting, any surface roughness or curvature produced during the sanding operation. Finished samples were stored inside the room. The ice samples were turned over periodically to reduce brine drainage, but they were not handled for more than a few minutes at a time, particularly during sanding, in order to reduce warming effects.

Fig. 1. Map showing location of sites.

Fig. 2. Salinity profile of ice cover at stations 1 and 2 during test period.

Fig. 3. Horizontal thin sections of columnar-grained sea ice at stations 1 and 2 at depths of 20 cm (direction of current or shoreline indicated by arrow).
Tests were made on samples with their principal axes oriented both vertically and horizontally with respect to the surface of the ice cover. Horizontally oriented samples were further prepared with the major axes either parallel to the direction of the current (or shoreline) or perpendicular to it (designated ||c and 1c, respectively). The dimensions of the finished samples were 40 × 40 × 140 mm and 20 × 40 × 140 mm, respectively, for horizontal and vertical samples. Load was applied across the 40 × 40 urn or 20 × 40 mm faces. Dimensional change in specimen length during a test was measured with a strain gauge mounted between the top and bottom platens (Reference SinhaSinha 1981). Two 6 V dry cells connected in parallel were used as a power supply for the direct current displacement transducers. The output of this gauge and that of the load cell were recorded simultaneously as functions of time on strip chart recorders kept warm inside an insulated, heated box that also housed the batteries and the electronics for the load cell. Most of the tests were carried out at -10°C.
A few horizontally-oriented samples from station 2 were weighed after the tests and their densities estimated from the dimensions measured before the tests. These samples were melted for salinity measurements.
Results
Examples of stress time and strain time relations are shown in Figure 4. The variation in strain-rate may be seen. All the samples tested at -10°C failed in a ductile manner, with a distinct upper yield value (see Figure 5 for position in the ice cover). Although horizontally oriented samples were tested at various rates, all the vertically oriented samples from both stations were tested at the same nominal strain-rate, ![]() , where L is specimen length and × is displacement rate. Differences in the response of vertical samples from the two stations are immediately noticeable. The horizontal samples from both stations, on the other hand, did not show any obvious differences in strength values. Figure 6 illustrates the dependence of upper yield or failure stress at on the corresponding time tf. The decrease of tf with increase of tf (for horizontal samples) and hence with increase in rate of loading conforms well, at least in a qualitative sense, with observations on similarly oriented freshwater columnar-grained ice (Reference SinhaSinha 1981).
, where L is specimen length and × is displacement rate. Differences in the response of vertical samples from the two stations are immediately noticeable. The horizontal samples from both stations, on the other hand, did not show any obvious differences in strength values. Figure 6 illustrates the dependence of upper yield or failure stress at on the corresponding time tf. The decrease of tf with increase of tf (for horizontal samples) and hence with increase in rate of loading conforms well, at least in a qualitative sense, with observations on similarly oriented freshwater columnar-grained ice (Reference SinhaSinha 1981).

Fig. 4. Stress-time and strain-time data obtained on horizontal samples (perpendicular to direction of current) from station 2 at a depth of 0.3 to 0,4 m subjected to five displacement rates.

Fig. 5. Vertical variation of strength observed in freshly recovered first-year sea ice at -10°C. The connecting lines for vertical samples indicate the same cores.

Fig. 6. Dependence of yield or failure time on yield or failure stress for fresh first-year sea ice at -10°C.
In examining the rate sensitivity of the strength of ice subjected to constant cross-head displacement rates, Reference SinhaSinha (1981) noted the following relation between of and tf for upper yield type of failure:

where c and θ are constants and 01 is the unit stress (1 MN m−2) and t1 is the unit time (one second). Laboratory experiments on horizontally oriented samples of columnar-grained S-2 ice at -10°C gave c = 3.35 × 10³ and θ = 2.30 for loading conditions of constant cross-head displacement rates.
Equation (1) has also been applied successfully to results obtained under truly constant strain-rate (Reference SinhaSinha 1982[b]). This is a familiar equation and similar to the dependence of rupture time on stress observed for metals, alloys and other materials.
Results on horizontal samples in Figure 6 seem to follow the pattern described by Equation (1). Re-gressional analysis of these data provided c = 210 and θ = 2.57, with a correlation coefficient of 0.84, so that
This is shown in Figure 5 by the solid line. The striking similarity in behaviour of sea ice and freshwater ice should be noted. Although there is a large difference in the values of the coefficients, the numerical values of the stress exponent are not significantly different. This raises the question of whether the value for the coefficient depends on brine content and the microstructure of the ice. The vertical samples seem to show an anomalous pattern in the dependence of tf on of (Fig.6.). A decrease in rupture time with decrease in load has not been observed before. This will be discussed in detail later.
In spite of large variations in the stress levels at upper yield, vertically as well as horizontally oriented samples from both stations did not differ appreciably in the magnitude of their failure strains (Fig.7.). There were, however, noticeable differences in the response of the two types of sample. Vertical samples showed no dependence of ef (failure strain) on of (failure stress), whereas decreasing ductility with higher of is evident for the horizontal samples. Differences in behaviour of the two types of sample are shown in Figure 8, in which of is plotted against average strain rate to yield, defined as ![]() Horizontal samples seem to indicate an increasing dependence of strength on strain-rate, but a reverse relation is evident for vertically oriented samples.
Horizontal samples seem to indicate an increasing dependence of strength on strain-rate, but a reverse relation is evident for vertically oriented samples.

Fig. 7. Dependence of strain on stress at upper yield for sea ice at -10°C.

Fig. 8. Dependence of upper yield or failure stress on average strain-rate.
Discussion
The change in horizontal strength with strain-rate agrees qualitatively with previous observations on similarly oriented freshwater ice (Reference SinhaSinha 1981) and sea ice (Reference WangWang 1979). The present results, however, indicate considerably lower values than Wang reported for horizontal samples of horizontally an-isotropic sea ice at Reindeer Island at the same temperature and in the same strain-rate range. Wang used cylindrical samples of the same length as those in the present series, but the cross-sectional areas were more than twice the corresponding areas in the samples used here. Moreover, he used a commercial closed-loop machine with more than 100 times the capacity of the present test frame, and his experiments were conducted under virtually constant strain-rates. The higher strength obtained by Wang, using an extremely stiff machine, would be expected from the analysis made by Sinha (19821 a]) if the present results were reported on the basis of nominal strain-rate. Results shown in Figure 8, however, are based on actual strain measurements, and it has been shown (Reference SinhaSinha 1982[b]) that the strength analysis based on ![]() , at least for freshwater S-2 ice, may not be different from the results obtained under truly constant strain-rate. Moreover, the strain-rate was not far from constant in many cases, particularly during the slow tests (Fig.4.). The large discrepancies between the present results and those of Wang could therefore be due to differences in the structural characteristics of the materials used.
, at least for freshwater S-2 ice, may not be different from the results obtained under truly constant strain-rate. Moreover, the strain-rate was not far from constant in many cases, particularly during the slow tests (Fig.4.). The large discrepancies between the present results and those of Wang could therefore be due to differences in the structural characteristics of the materials used.
One material difference that can be compared readily is salinity. Wang, however, did not provide any salinity data on the ice he tested. Perhaps it should be pointed out that the salinities of the horizontal samples used in the present series were rather high because of the use of ice from the top 0.5 m of the ice cover (Fig.2.). The precautions taken in the preparation of the samples did not seem to allow any objectionable brine drainage, as can be seen in Figure 9, which shows the salinity and density of some of the samples measured a few hours after the tests. Figure 9 also indicates that the ice was very dense and contained little air.
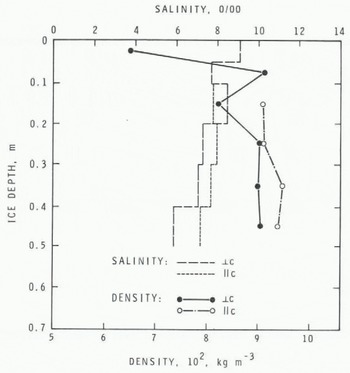
Fig. 9. Salinity and density (at -10°C) profile of ice cover at station 2. Horizontally-oriented samples after strength tests were used for these measurements.
When a test system is operated near the limit of its loading capacity, erroneous behaviour of the total system is unavoidable. This was particularly true in testing vertical samples. It was obvious during preliminary testing that any attempt to examine the vertical samples might not be useful, other than to show that vertical strength could be much greater than horizontal strength. The results shown in Figure 7 illustrate this quite clearly and confirm previous observations by Reference PeytonPeyton (1966). There is an apparently anomalous characteristic in the behaviour of the vertical samples (Fig.8.) that raises questions, since decrease in strength with increase in strain-rate has not been seen before for upper yield type failures. A detailed discussion of these results is considered necessary because it is important to know the vertical strength if one intends to study the mechanical problems related to ice ridges or ice rubble fields.
The first question concerns the accuracy of the strain measurement. No doubt there were errors, but they could not have been large because of the precautions taken in the preparation of the sample end surfaces. This confidence stems from previous experience in comparing strain measured between two end platens and deformation estimated simultaneously, with gauges mounted directly on the specimen. This has been discussed by Reference SinhaSinha (1981), who has shown that both measurements can give comparable results provided the specimen end surfaces are prepared extremely carefully. Although the field situations now reported were far from ideal, direct support for this confidence comes from the measured strain-rates. For the vertical samples in Figure 8, the measured strain-rates are comparable to the nominal strain-rate setting of about 6.1 × 10⁻⁵ used in all these tests. Another observation must also be stressed. The best agreement between measured and nominal strain-rate (for these tests) occurred when total load was minimum, i.e. at of = 4 MPa, giving a total load of about 3 kN. This is a third of the total capacity of the machine. It is apparent, therefore, that as the load requirement increased the machine could not maintain the initial displacement rate, resulting in a progressively decreasing value in the rate of sample deformation and hence in the average strain-rate measured for samples showing high strengths. The systematically decreasing strain-rate with increasing strength shown in Figure 8 for vertical samples indicates, in fact, the increasing struggle between the sample and the test system and hence the deviation of the displacement rate from a constant value during a test for samples showing high strengths.
This anomaly can also be seen in Figure 6, which illustrates longer failure times for higher upper yield stresses. Examination of data tabulated in Frederking and Timco (1981) for vertical samples also reveals a similar trend. If this observation is accepted, it leads to the absurd conclusion that ice will break almost instantaneously under a negligibly small load. Such observations make the results obtained for vertical samples of questionable value. The requirement of a lower cross-sectional area (to keep the load lower) in the present study makes the results even more questionable. By the same token, it is believed that the results obtained for horizontal samples are more acceptable, a conclusion supported by the observation that the total load required for horizontal samples never exceeded a third of the capacity of the machine.
For conditions where the strain-rate in the specimen cannot be controlled, as in most conventional test systems designed to maintain constant cross-head or displacement rate, an alternate method of presenting the result on the basis of load or stress-rate has been suggested (Reference SinhaSinha 1981). This proposal grew out of the observation that constant displacement rate results in a nearly constant stress-rate path for most of the loading cycle. There is justification for this approach in that load and time can both be measured readily and accurately under most conditions. Moreover, the response of a test system is reflected in the measured loading rate. Consistent results can be obtained by using stress-rate for most conditions when the effect of system stiffness cannot be accounted for in a quantitative manner (Sinha and Frederking 1979). These results should not, however, be considered the material property under truly constant stress-rate. The effect of truly constant stress-rate on strength was discussed by Sinha (1982[b]) when he showed that the stress-rate dependence of upper yield stress, as derived from the results with a conventional system, underestimates strength under truly constant stress-rate. This is primarily because stress-rate approaches zero at upper yield and then reverses in a conventional system undergoing ductile failure.
Owing to the problems encountered in the present system and to the fact that they could be common to field test equipments in general, strength data were examined on the basis of stress-rate. Figure 10 illustrates all the results in terms of average stress-rate to yield or failure, defined as
where o1 is the unit stress-rate (1 MN m−2 s−1).

Fig. 10. Dependence of upper yield or failure stress on average stress-rate.
The apparently erroneous response of the vertical samples is not evident in Figure 10, and both types of sample exhibit an increasing dependence of strength on rate of loading. Almost identical responses in the strengths of the two types of sample were also reported by Frederking and Wright (1982). The sharp increase in strength with stress-rate for vertical samples also agrees extremely well with observations reported by Frederking and Timco (1981).
Figure 10 indicates that both types of sample could have the same strength at a stress-rate of about 2 × 10⁻² MN m−2 s−1. The vertically oriented samples could also have strengths lower than those of horizontal samples at rates of loading lower than about 2 × 10⁻² MN m−2 s−1. This is confusing; however, a similar trend in the results of both types of samples can also be seen in Frederking and Wright (1982). Stress-rate analysis, therefore, should be examined carefully by including the time aspect of the tests. Substitution of tf/t1 in Equation (1) by

from Equation (31 and rearrangement gives

or
Where m = 1 1/(1+θ) and M = cm.
Examination shows that if θ>0 in Equation (1), then m l in Equation (5) because m = 1/(1+θ) by definition. On the other hand, m>l means that θ<0, and this indicates, according to Equation (1), an increase in tf with increase in of, as shown in Figure 6 for vertical samples. Thus m>l would imply what is impossible: that failure would occur immediately for a negligibly small load and that the material would last forever if the load were infinitely large. The numerical value of m could therefore be used to assess the quality of the results.
The power law relation, of the type expressed by Equation (5), between of and oaf is convenient and applicable to experimental results by plotting log of against log oaf. The result should give a straight line if the power law applies. The slope of this line gives m and the intercept at the chosen unit stress-rate gives M. For m<l the line should make an angle less than 45° with the log oaf axis. The values of c = 210 and θ = 2.57, determined earlier for horizontal samples of sea ice, give m = 0.28 and M = 4.47, so that Equation (5) gives
Equation (6) is shown in Figure 10 and is a fair description of the experimental results. These gave a line with a slope of about 16° for m = 0.28 when plotted on a graph of log of against log oaf. In contrast, the vertical samples seem to be satisfied by a line making an angle greater than 50°, not only for the present series of tests but also for the results presented by Frederking and Wright (1982) and Frederking and Timco (1981).
This discussion would be incomplete if results obtained with another test machine were not mentioned, even briefly. These tests were performed on freshly recovered, first-year columnar-grained sea ice from Mould Bay, Prince Patrick Island, in the western Arctic. They were carried out in October 1981 in the same field laboratory that was used in Eclipse Sound, but using a commercial test machine (Solltest CT405) designed to have a load capacity of 50 kN, It therefore had a capacity five times greater than that of the test system used in Eclipse Sound, permitting larger samples to be used. Prismatic specimens 51) × 100 × 250 ram, with the axis of the columns perpendicular to the 100 × 250 ram face, were tested. Load was applied across the 50 × 100 mm face, i.e. perpendicular to the columns. The cross-sectional areas of these samples were therefore about three times greater than those used in the earlier tests. Results obtained at -10°C on the same horizontally oriented samples with the prism axis parallel to the current in Mould Bay are also presented in Figure 10. Agreement with the previous results is considered excellent. Total load, as may be seen from Figure 10, did not exceed even a quarter of the total loading capacity of the system, so that loading conditions were comparable to those applied to the horizontal samples in the earlier tests. A detailed report on this test series and others carried out at Mould Bay will be presented shortly.
Conclusion
Strain-rate sensitivity of the unconfined uniaxial compressive strength of freshly recovered, columnar-grained first-year sea ice was examined in a field laboratory on top of the ice cover in Eclipse Sound near Pond Inlet, Baffin Island. Prismatic samples with their principal axes in both the vertical and horizontal planes (with respect to the ice cover) were tested at -10°C under quasi-constant displacement rates. A portable test machine was used. Horizontal upper yield stress of for ice with salinity of 6 to 10°/oo was found to vary, with large scatter, from about 1.2 to 2.2 MN m−2 in the average strain-rate range of 7 × 10⁻⁵ to 2 × 10⁻⁴ s_1, or in the average stress-rate range of 6 × 10⁻³ to 7 × 10⁻² MM m−2 s−1. Strain at upper yield of varied in the range of about 4 × ID−3 to 10 × 10−3, with a tendency for decreasing ductility with increasing strength. An inverse power law dependence between failure time of and of was observed with a stress exponent of 2.6, which is comparable with results for freshwater columnar-grained S-2 ice. As the strain-rates during the tests were not constant, stress-rate analysis was also carried out. Scatter in the data was markedly reduced when of was plotted as a function of average stress-rate oaf to upper yield. A power law dependence between of and of was found with a stress-rate exponent of 0.28, This also agrees well with results obtained for freshwater S-2 ice.
The coefficient for sea ice, however, was different from that for freshwater ice and was thought to depend on brine volume in the ice and on its structure.
Vertically oriented samples were significantly stronger than horizontal samples, but they were smaller in size and the results may not represent the material property. The strain-rate sensitivity of the strength of these samples showed an anomalous behaviour believed to be linked to the problems encountered with the capacity of the machine and its inability to maintain constant displacement rate during a test.
A method has been suggested, in the absence of any strain and strain-rate information, of verifying the data on the basis of stress-rate analysis. The stress-rate exponent should be less than 1 if the results are even to be considered. The time aspect of the test should also be investigated and, if possible, machine performance under actual loading conditions examined. It is recommended that vertical samples should be tested with test systems of much higher capacity than those required for horizontal samples of the same size.
Acknowledgements
The author wishes to express his thanks to R Jerome for his assistance in carrying out the data analysis, and to H Steltner, M Komangapik and S Koonark for assistance in the field. Dr E Lewis kindly permitted the use of the portable laboratory. The author is most grateful also to Dr R 0 Ramseier and the Radarsat-1981 team of Atmospheric Environment Service of Canada for their invaluable assistance at Mould Bay. This paper is a contribution from the Division of Building Research, National Research Council Canada, and is published with the approval of the Director of the Division.


