


CHD is a major public health problem worldwide, and it has become one of the leading causes of morbidity and mortality in several countries( Reference Roth, Huffman and Moran 1 ). The World Health Organization( 2 ) estimated that 17·5 million people died from CVD in 2012, and of these 7·4 million deaths were due to CHD, with over 80 % of them occurring in low- and middle-income countries. According to the analysis of the Global Burden of Disease in Mexico, IHD is the leading cause of years of life lost( 3 ).
The occurrence of CHD is mainly determined by pre-existing clinical conditions such as hypertension, dyslipidaemia and type 2 diabetes( Reference Eaton 4 ). All of these chronic diseases are highly prevalent among the Mexican population, leading to increased CHD risk at younger ages( Reference Gutiérrez, Rivera-Dommarco and Shamah-Levy 5 ).
Specific lifestyle patterns, particularly diet, are strongly associated with these cardio-metabolic disorders( Reference Kromhout, Menotti and Kesteloot 6 ). There is a need to identify lifestyle patterns that may help to reduce CHD risk in our population, such as beverage consumption patterns( Reference Zhang and Hu 7 ). Previous studies suggest that moderate alcohol intake is inversely associated with CHD( Reference Djoussé, Lee and Buring 8 – Reference Zheng, Lian and Shi 10 ). The cardio-protective effect of moderate alcohol consumption may be related to changes in lipoprotein profiles, inflammatory cytokines (IL 6, C-reactive protein and TNF-α) and insulin resistance( Reference Djoussé, Lee and Buring 8 , Reference O’Keefe, Bybee and Lavie 11 ). In addition, increased sugar-sweetened beverages (SSB) intake has been associated with insulin resistance, lower HDL-cholesterol, higher deposit of visceral fat and increased TAG concentrations, as well as the metabolic syndrome( Reference Huang, Huang and Tian 12 – Reference Denova-Gutiérrez, Talavera and Huitrón-Bravo 15 ).
Increased SSB consumption trends during the past several decades subsequently suggest that there are significant changes to the general Mexican population nutritional profile( Reference Barquera, Hernandez and Tolentino 16 ). Mexico is the world’s largest per capita consumer of SSB. For this reason, it is important to explore the potential effects of these new beverage consumption patterns on CHD within the Mexican population. From 2006 to 2012, SSB has led to a marked increase in per capita energy consumption( Reference Barquera, Hernandez and Tolentino 16 , Reference Stern, Piernas and Barquera 17 ). Analysis of consumption patterns provides additional information on the potential effects coming from the consumption of specific beverages, which cannot be determined when only individual beverage consumption patterns are examined( Reference Hu 18 ). Thus, the purpose of this study is to identify beverage consumption patterns and their potential relationship with CHD risk among the Mexican adult population.
Methods
Study population
We performed a cross-sectional analysis of the baseline assessment of the Health Workers’ Cohort Study (HWCS). The study design, methodology and participants’ baseline characteristics have been described elsewhere( Reference Denova-Gutiérrez, Flores and Gallegos-Carrillo 19 ). The original study’s purpose was to assess the relationship between lifestyles and health outcomes with data from workers at the Instituto Mexicano del Seguro Social (IMSS, by its acronym in Spanish) and the Instituto Nacional de Salud Pública (INSP, by its acronym in Spanish), which are both located at the Universidad Autónoma del Estado de México in Cuernavaca Morelos (UAEMex, by its acronym in Spanish). The HWCS is a dynamic cohort study with data from 10 079 subjects aged between 18 and 85 years including active and retired workers, as well as their families( Reference Denova-Gutiérrez, Talavera and Huitrón-Bravo 15 , Reference Denova-Gutiérrez, Flores and Gallegos-Carrillo 19 ).
Of the 10 079 Mexican women and men, we excluded subjects who did not meet the age criteria (20–70, n 1267), subjects with a prior CVD diagnosis (n 412), subjects with weight change >10 kg in the last year (n 137), any outlier energy values (<2510·4 and >29 288 kJ/d (<600 and >7000 kcal/d))( Reference Rosner 20 ) (n 142), subjects with missing information on smoking (n 294), BMI (n 428), physical activity (n 130), LDL-cholesterol and HDL-cholesterol (n 584). In addition, we excluded subjects with serum creatinine >176·8 μmol/l (n 9) and women with missing information on menopausal status (n 36). After excluding subjects who did not meet our study criteria, a total of 6640 subjects aged 20–70 years were included in the final analysis.
All participating institutions’ research ethics committees (Comité de Ética en Investigación, IMSS (no. 12CEI 09 006 14); Comité de ética en Investigación, INSP (no. 13CEI 17 007 36); Comité de Ética, Centro de Investigación en Ciencias Médicas (no. 1233008×0236)) revised and approved the study protocol and informed consent forms. Written informed consent was obtained from each participant.
Dietary assessment
A previously validated( Reference Hernández-Avila, Romieu and Parra 21 ) semi-quantitative FFQ was used to assess diet through collecting data on the frequency of consumption of 116 food items during the previous year. For each food item, a commonly used portion size (e.g. one slice of bread) was specified and participants were asked how frequently they had consumed the food over the previous year. They were able to choose from ten responses ranging from ‘never’ to ‘six or more times per day’. The energy and nutrient intake was estimated by multiplying the frequency of consumption of each food type included in the FFQ by the nutrient content estimated with a comprehensive database of food contents( Reference Denova-Gutiérrez, Flores and Gallegos-Carrillo 19 , Reference Hernández-Avila, Resoles and Parra 22 ).
Beverage patterns
To determine beverage consumption patterns, we started by first grouping all beverages into eight different categories according to their energy and nutrient density contribution to total energy intake, fat content and alcohol content. The categories were high-fat milk (whole milk; coffee with milk; atole with milk and chocolate with milk); low-fat milk (reduced fat and skimmed milk); homemade sweetened beverages (fruit-flavoured or artificial); soft drinks (soda); diet drinks (low-energy drinks); other sweetened beverages (coffee, atole, chocolate and tea without milk); alcoholic beverages (beer, whisky, brandy, tequila, rum, hard liquor and pulque); and wine. Wine was placed in a separate category from the other alcoholic beverages because it has greater antioxidant and anti-inflammatory activity( Reference Arranz, Chiva-Blanch and Valderas-Martínez 23 ). Second, we converted drink volume (ml) into a portion of the total volume/d and standardised using z scores. Third, using a principal components analysis of the beverage groups, beverage consumption patterns were categorised. The factors (beverage patterns) were orthogonally rotated (varimax rotation) in order to ensure that they were uncorrelated and to make their interpretation easier to understand. Factor values were determined after the assessment of eigenvalues, graphic analysis and interpretability. Each factor was defined by a subgroup that placed drinks on the axis of the factor, with an absolute load ≥0·3 (groups with a factor of load ≥0·3 will be considered as a significant contribution to the beverage pattern)( Reference Denova-Gutiérrez, Tucker and Flores 24 ). The derived factors were labelled in relation to make the data easily interpretable. Each factor was defined by a subset of drinks with an absolute ≥0·3 load factor (considering that ≥0·3 load factors contributed significantly to the dietary pattern)( Reference Denova-Gutiérrez, Tucker and Flores 24 ). These factors were labelled in a way that could be easily interpreted.
Assessment of non-dietary variables
Demographic characteristics were evaluated from data reported on self-administered questionnaires. Physical activity was assessed using the International Physical Activity Questionnaire (IPAQ) adapted to the Mexican population( Reference Denova-Gutiérrez, Flores and Gallegos-Carrillo 19 , Reference Martínez González, López and Varo 25 ). In this questionnaire, participants reported time spent practising specific activities in their free time through sixteen questions that also assessed the time dedicated by each person per week to these activities. These activities included physical activity such as walking, running and cycling. Work-related physical activity was also assessed through eight questions on activities such as sitting, standing, walking, lifting and using heavy machinery during a typical week of the previous year( Reference Denova-Gutiérrez, Flores and Gallegos-Carrillo 19 , Reference Martínez González, López and Varo 25 ).
Anthropometric and clinical assessment
Weight was measured using a previously calibrated electronic scale (model BC-533; TANITA) with participants wearing minimum clothing and no shoes. Height was measured using a conventional stadiometer while the subjects were standing, barefoot, with both shoulders aligned. Waist circumference was assessed to the nearest 0·1 cm at the high point of the iliac crest at the end of normal expiration; the tape was placed below any clothing, directly touching the participant’s skin. BMI (kg/m2) was derived by dividing the body weight (kg) by the height squared (m2). Proportion of body fat was estimated by means of dual-energy X-ray absorptiometry performed with a Lunar DPXL densitometer (Lunar Radiation Corp. software version 1.35, fast scan mode; model: DPX-NT 73735, series: 638405U77).
Blood pressure was measured with an electronic digital blood pressure monitor. Participants were seated with their right arm resting at heart level. For the participants from UAEM, three blood pressure measurements were obtained and the mean of the last two measurements was used to assess CHD risk. For the participants from INSP and IMSS, one blood pressure measurement was obtained. Measurement of these anthropometric criteria and blood pressure was performed by nurses trained to perform standardised procedures (reproducibility was evaluated, resulting in a concordance coefficient of 0·83–0·90). A fasting venous blood sample (fasting time was ≥8 h) was collected from each participant. HDL-cholesterol was measured by the clearance method, in which non-HDL-cholesterol lipoprotein is removed in the first step of the reaction (clearance step); LDL-cholesterol was also measured by the clearance method. Total cholesterol was measured by colorimetric method following the enzymatic assay. Plasma TAG were measured with a colorimetric method following enzymatic hydrolysis performed with the lipase technique. All biomedical assays were performed using a Selectra XL instrument (Randox), in concordance with the proceedings of the International Federation of Clinical Chemistry and Laboratory Medicine( Reference Flores, Auslander and Crespi 26 ). The cardiovascular risk factors were defined according to the criteria of the National Cholesterol Education Program ATP-III, as follows: high serum TAG ≥150 mg/dl (≥1·7 mmol/l), high serum total cholesterol ≥200 mg/dl (≥5·2 mmol/l), high LDL-cholesterol ≥100 mg/dl (≥2·6 mmol/l) and low HDL-cholesterol <40 mg/dl (<1·0 mmol/l) for men and <50 mg/dl (<1·3 mmol/l) in women( Reference Tate, Rifai and Berg 27 ). Finally, diabetes was defined as fasting glucose ≥126 mg/dl (≥7·0 mmol/l), self-reported physician diagnosis or a self-reported use of hypoglycaemic treatment( 28 ).
Estimation of the Framingham CHD risk score
CHD risk was calculated using a previously validated calibration of the Framingham CHD Risk Score( Reference D’Agostino, Grundy and Sullivan 29 ). Sex-specific prediction algorithms that included age, cigarette smoking, blood pressure, diabetes and levels of HDL-cholesterol and LDL-cholesterol were computed. We defined participants with moderate to high risk of CHD when they had more than 10 % risk in 10 years as was proposed in previous reports( Reference Denova-Gutiérrez, Tucker and Flores 24 ).
Statistical analysis
We performed a descriptive analysis of the demographic and clinical variables by sex and quintiles of each beverage pattern. To assess differences between groups, we conducted a χ 2 test for categorical variables and a Student’s t test or one-way ANOVA for continuous variables.
To estimate the association between beverage patterns and risk of CHD, as well as other cardiovascular risk factors, we performed multivariable logistic regression models in order to estimate OR and 95 % CI, adjusting for potential confounding variables. The first model was adjusted for sex and age, whereas the second model was additionally adjusted for leisure time, physical activity, menopause, multivitamin supplements, medication use (treatment for diabetes, hypertension and hypercholesterolaemia) and aspirin use. Smoking and BMI were also included in the adjustment for the second model but only for blood lipids as a response variable. In the third model, we adjusted for energy intake and prudent pattern, meat/fish and refined foods consumption patterns. The fourth model was adjusted for smoking. In addition, an age-stratified analysis was performed (<45 years, 45–56 years and >56 years). The selection of the confounding variables was determined on the basis of previous scientific evidence. An additional sensitivity analysis with different parameters for total energy intake (<2092 and >14 644 kJ/d (<500 and >3500 kcal/d)) was performed. Individuals who did not meet the assigned energy criteria were excluded from this analysis (n 336).
All P values presented are two-tailed; a P value <0·05 was considered statistically significant. All statistical analyses were performed using the STATA statistical software package version 14.0 (StataCorp LP).
Results
We identified four major beverage consumption patterns named according to the beverage groups that had positive high loadings (Table 1). Alcohol consumption was characterised by high alcohol intake and was explained by 17·9 % of the variance. The main beverages consumed in this pattern were beer, brandy and wine (data not shown). The coffee/tea pattern explained 16·6 % of the variance and was defined by a high intake of coffee, tea and other non-dairy drinks, as well as low intake of high-fat beverages. The soft-drink pattern explained 15·9 % of the variance and was characterised by a relatively high intake of sugar-sweetened carbonated drinks, and a low intake of homemade sweetened beverages, as well as low-energy drinks. The low-fat milk pattern explained 15·4 % of the variance and was defined by a relatively high consumption of low-fat milk and a lower intake of industrialised sweetened beverages. Together, all four factors (beverage patterns) explained 65·8 % of the total variance.
Table 1 Factor-loading matrix for patterns of beverage consumptionFootnote *
* Factor loadings >0·3.
The study population was mainly composed of middle-aged participants (42·4 years old). Most participants were women (71·6 %), and the women in our study were less likely to be overweight, less likely to have a higher proportion of body fat, as well as a lower prevalence of low HDL-cholesterol, higher intake of low-fat beverages, lower dietary glycaemic load and a higher fibre and vitamin D consumption compared with men. In addition, women were less physically active during leisure time, smoked less, had a lower prevalence of lipid abnormalities, lower CHD risk and a lower soft-drink and alcohol consumption compared with men (P value <0·05) (data no shown).
Subjects in the highest quintile of the alcohol consumption pattern had a lower prevalence of obesity, lower body fat, HDL-cholesterol and diabetes, but also had a higher mean score of CHD risk in comparison with the lowest quintile. They were also more physically active during leisure time, were more likely to currently smoke, had lower dietary glycaemic load and higher vitamin D intake compared with subjects in the lowest quintile. Low-fat milk consumption patterns yielded similar results to alcohol consumption patterns, except for the lower smoking prevalence and higher prevalence of diabetes. Participants in the top quintile of the coffee/tea pattern had higher prevalence of current smoking, had less prevalence of diabetes and less intake of saturated fats and vitamin D compared with participants in the bottom quintile. We observed that subjects in the highest quintile of soft-drink consumption pattern were older, had a higher prevalence of obesity, higher CHD risk, higher prevalence of low HDL-cholesterol and higher elevated LDL-cholesterol and TAG. These subjects were also less physically active during leisure time; had a higher prevalence of current smoking; had less energy intake, fibre intake and dietary glycaemic load; and also a higher intake of saturated fats compared with those in the lowest quintile (Table 2).
Table 2 Characteristics of participants in the Health Worker Cohort Study by quintiles of beverage patterns
SSB, sugar-sweetened beverages.
*P values <0·05 from one-way ANOVA (continuous variables) or χ 2 test (categorical variables) for quintile 1 v. quintile 5.
† Mean values.
‡ To convert cholesterol in mg/dl to mmol/l, multiply by 0·0259. To convert TAG in mg/dl to mmol/l, multiply by 0·0113.
We observed a slight difference between adjusted and crude estimations. Subjects in the upper quintile of the alcohol consumption pattern had lower CHD risk (OR 0·56; 95 % CI 0. 43, 0·74) and lower odds of low HDL-cholesterol (OR 0·74; 95 % CI 0·60, 0·91). The coffee/tea pattern is not significantly associated with CHD (OR 0·81; 95 % CI 0·60, 1·09); however, subjects in the upper quintile of this pattern had lower odds of high serum cholesterol (OR 0·32; 95 % CI 0·26, 0·40). On the other hand, participants in the upper quintile of the soft-drink pattern had increased CHD risk (OR 1·53; 95 % CI 1·13, 2·07), increased odds of presenting high LDL-cholesterol (OR 1·20; 95 % CI 1·01, 1·42) and were more likely to have lower HDL-cholesterol (OR 1·39; 95 % CI 1·13, 1·71) compared with those in the lowest quintile. In addition, participants in the upper quintile of the low-fat milk pattern had lower CHD risk (OR 0·66; 95 % CI 0·48, 0·90) and lower odds for low HDL-cholesterol (OR 0·68; 95 % CI 0·55, 0·84) compared with subjects in the lowest quintile (Tables 3 and 4). The results for all pattern groups are maintained despite the adjustment for BMI (model V). Results for the sensitivity analysis with different energy parameters are shown in the online Supplementary Table S1; the results of Tables 1, 3 and 4 remained similar.
Table 3 Cardiovascular risk factors according to alcohol and coffee/tea patterns (Odds ratios and 95 % confidence intervals)
* Model I: adjustment for sex; age (years).
† Model II: additional adjustment for leisure time physical activity (≥30 min/d); menopause; use of multivitamin supplements; medication use (treatment for diabetes, hypertension and hypercholesterolaemia); and aspirin use.
‡ Model III: additional adjustment for intakes of total energy (quintiles); prudent pattern (quintiles); meat/fish pattern (quintiles); and refined food pattern (quintiles).
§ Model IV: additional adjustment for BMI (normal, overweight and obesity) and smoking status.
Table 4 Cardiovascular risk factors according to soft-drink and low-fat milk patterns (Odds ratios and 95 % confidence intervals)
* Model I: adjustment for sex; age (years).
† Model II: additional adjustment for leisure time physical activity (≥30 min/d); menopause; use of multivitamin supplements; medication use (treatment for diabetes, hypertension and hypercholesterolaemia); and aspirin use.
‡ Model III: additional adjustment for intakes of total energy (quintiles); prudent pattern (quintiles); meat/fish pattern (quintiles); and refined food pattern (quintiles).
§ Model IV: additional adjustment for BMI (normal, overweight and obesity) and smoking status.
Results for the age-stratified analysis of beverage patterns and CHD risk are presented in Fig. 1. Associations are not statistically significant across all age strata for alcohol, soft drinks or low-fat milk. This could be potentially explained by the limited sample size; however, the direction of the association shown in the analysis remains.
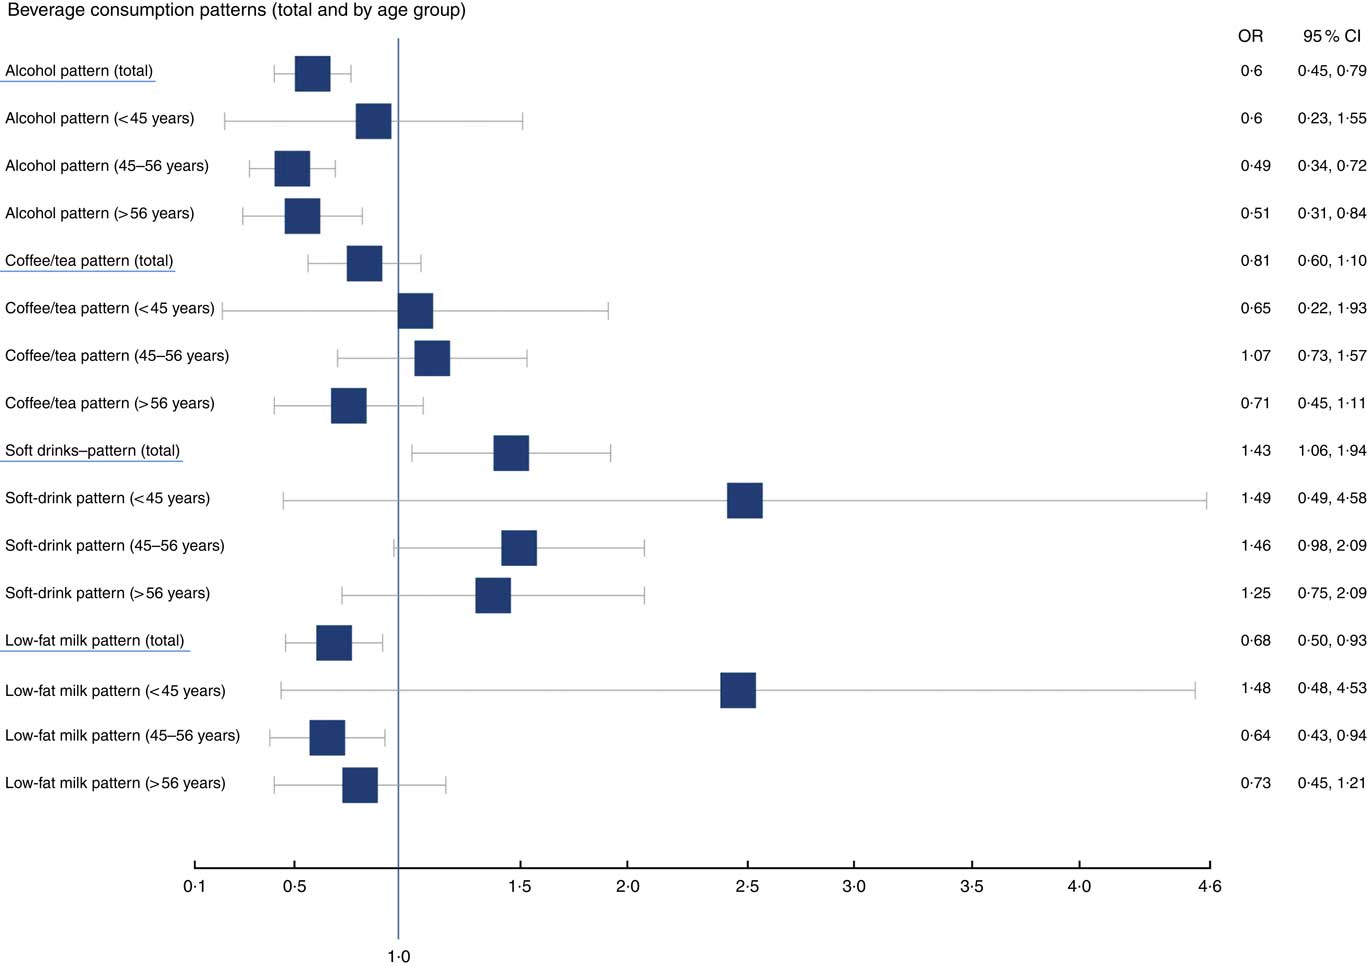
Fig. 1 OR of cardiovascular risk factors and patterns of beverage consumption, age-stratified analysis.
Discussion
By means of factor analysis, we identified four major beverage consumption patterns: ‘Alcohol’, ‘Coffee/tea’, ‘Soft drinks’ and ‘Low-fat milk’. The Alcohol and Low-fat milk groups showed an inverse association with CHD, whereas the soft-drink pattern showed a positive association. Additional adjustment for BMI or total body fat proportion attenuated the association between beverage patterns and CHD; however, it remained significant (data not shown)( Reference Flint, Rexrode and Hu 30 ). Obesity is part of the causal chain of these associations leading to chronic inflammation and increased cytokines by adipocytes( Reference Flint, Rexrode and Hu 30 , Reference Wang and Nakayama 31 ). Therefore, additional adjustment for BMI may be unnecessary.
Regarding alcohol intake among our population, the highest quintile of the Alcohol pattern represents an average of 1 cup/d for women and 2 cups/d for men. Our results are similar to those of the literature that observed an association between moderate alcohol consumption (1 cup/d for women and 2 cups/d for men) and lower CHD risk( Reference Zhang, Shu and Si 9 , Reference Zheng, Lian and Shi 10 ). For example, the Health Professionals Follow-up Study reported that men who consumed alcohol daily, regardless of the type of drink, had a lower CHD risk( Reference Mukamal, Conigrave and Mittleman 32 ). The Women’s Health Initiative Observational Study showed that moderate alcohol intake is inversely associated with CHD risk( Reference Rajpathak, Freiberg and Wang 33 ). In a recent review paper combining results from eighty-four observational studies, moderate alcohol drinkers were reported to have reduced risk of CVD outcomes compared with non-drinkers, although heavy drinkers had the highest CVD risk of all(34). With regard to mechanisms underlying the effects of alcohol on lipid metabolism, alcohol consumption has been shown to increase the activity of lipoprotein lipase and decrease the activity of cholesterol ester transfer protein, resulting in the elevation of HDL-cholesterol( Reference Van de Wiel 35 ).
With respect to the SSB intake, previous studies showed that SSB consumption increases CHD risk( Reference Huang, Huang and Tian 12 , Reference Fung, Malik and Rexrode 13 , Reference Denova-Gutiérrez, Tucker and Flores 24 , Reference Duffey, Steffen and Van Horn 36 ). A meta-analysis showed increased CHD risk in the upper category of SSB intake compared with the lowest category (relative risk (RR)=1·17; 95 % CI 1·07, 1·28)( Reference Huang, Huang and Tian 12 ). The Nurses’ Health Study reported that women with a daily intake of ≥1 drink had increased CHD risk compared with women who did not drink SSB( Reference Fung, Malik and Rexrode 13 ). Studies evaluating complete dietary patterns and CHD showed that the pattern typified by a high intake of SSB is associated with increased CVD risk( Reference Denova-Gutiérrez, Tucker and Flores 24 , Reference Duffey, Steffen and Van Horn 36 ). A longitudinal study with data from our cohort (HWCS) shows that subjects in the highest quintile of the ‘refined foods’ pattern characterised by SSB have an increased risk of CVD, compared with those in the lowest quintile (RR=2·98; 95 % CI 1·46, 6·10)( Reference Denova-Gutiérrez, Tucker and Flores 24 ). Longitudinal and cross-sectional studies have observed similar results for HDL-cholesterol. For example, Denova-Gutiérrez et al.(15) showed that individuals with a consumption of ≥1 serving/d of SSB were two times more likely to have low HDL-cholesterol than those with zero consumption. Dhingra et al.(37) found that ≥1 portion of soft drinks per day increases the incidence of low HDL-cholesterol by 38 % compared with subjects who do not consume soft drinks. Nevertheless, there are some studies( Reference Hoare, Varsamis and Owen 38 , Reference Khan and Sievenpiper 39 ) that have found no association between SSB consumption and CHD, such as a systematic review conducted by Hoare et al.(38) in which they claim that there is consistent evidence that SSB consumption has adverse associations with weight, but there are insufficient data to assess relationships with cardiometabolic outcomes.
The association between coffee or tea consumption and CHD or lipid profiles is still not well studied, and previous epidemiological study results draw different conclusions( Reference Tokunaga, White and Frost 40 – Reference Kouli, Panagiotakos and Georgousopoulou 47 ). Previous studies reported that coffee or tea consumption is inversely associated with CHD or serum lipids( Reference Tokunaga, White and Frost 40 , Reference Davies, Judd and Baer 41 ). On the other hand, some studies reported no relation or higher risk between coffee or tea consumption and the CHD or lipid profile( Reference Davies, Judd and Baer 41 – Reference Kim, Chiu and Barone 43 ). We observed an inverse association between beverage pattern characterised by Coffee/tea with low HDL-cholesterol and total cholesterol. Possible biological mechanisms may explain these associations and have something to do with the antioxidants found in coffee and tea, such as vitamin C, several B vitamins, Mg, K, Mn and fluoride( Reference Suzuki, Miyoshi and Isemura 44 , Reference Higdon and Frei 45 ). In addition, these drinks contain polyphenols, which have a beneficial effect on cholesterol levels. Studies in rats suggest that polyphenols limit cholesterol absorption and promote efflux of cholesterol accumulated in cells, as well as inhibit LDL-cholesterol oxidation in vivo owing to increasing serum concentrations of HDL-cholesterol( Reference Dhingra, Sullivan and Jacques 37 , Reference Ikeda, Imasato and Sasaki 48 ).
One outstanding result of our study is the inverse association between the low-fat milk pattern and CHD that is consistent with the results of other prospective cohort studies( Reference Ness, Smith and Hart 49 , Reference Elwood, Strain and Robson 50 ). Milk is rich in minerals (Ca, K and Mg), protein (casein and whey) and vitamins (riboflavin, vitamin D and vitamin B12) that can exert beneficial effects on CVD( Reference Jakobsen, O’Reilly and Heitmann 51 ). For example, two individual meta-analyses have reported an inverse relationship between higher Ca intake and reduced blood pressure( Reference Allender, Cutler and Follmann 52 , Reference Bucher, Cook and Guyatt 53 ). In addition, one of the established properties of milk fat relative to polyunsaturated oils is the increase in concentration of HDL-cholesterol, which is associated with protection from heart disease( Reference Mensink, Zock and Kester 54 ).
In our study, we observed different CHD risk scores for men and women (7·7 and 4·7, respectively, data no shown). This result is similar to those obtained in the National Health and Nutrition Examination Survey) (8·6 in men and 4·7 in women) and those obtained by Karim et al. with data of the B-Vitamin Atherosclerosis Intervention Trial (13·0 men and 6·0 women, respectively, P<0·001)( Reference Bucher, Cook and Guyatt 53 , Reference Mensink, Zock and Kester 54 ). Sex is one of the main risk factors for CHD owing to exposure to endogenous oestrogens during the fertile period and, at this stage, the rate of CHD events is low( Reference Maas and Appelman 55 ). When we stratified by sex, we observed that the association is stronger in menopausal women, OR 1·79 (95 % CI 1·19, 2·70), and non-menopausal women, OR 1·21 (95 % CI 0·49, 3·03). On the other hand, for men this association was NS (OR 1·11; 95 % CI 0·70, 1·77), which can be attributed to a small sample size. We also explored the association for a ≥20 % CHD risk and observed an OR of 1·35 (95 % CI 0·65, 2·80) for women in the highest quintile of the soft-drink pattern and 1·96 (95 % CI 0·84, 4·56) for men when compared with subjects in the lowest quintile.
There are some limitations that must be considered for the interpretation of our results. First, given the cross-sectional nature of this analysis, we cannot infer that observed associations are causal. Despite the fact that FFQ is a standard method for collecting information on dietary intake, estimates derived from this instrument are not error-free. Nevertheless, our questionnaire had been previously validated and a recently published article by Denova-Gutiérrez et al. used a similar FFQ instrument, which found reasonable interclass correlation for some beverage groups (e.g. 0·29 for alcoholic beverages, 0·47 for sweetened beverages and 0·64 for soft drinks)( Reference Denova-Gutiérrez, Tucker and Salmerón 56 ). Another limitation is that we did not consider water consumption as part of a beverage group to be included in the analysis as we excluded the water-related question in the FFQ owing to misinterpretation. Factor analysis has some limitations related to methodological variation, including the number of food groups used in factor analysis, the number of factors and the rotation employed. However, the techniques we used are empirically derived and are, therefore, not limited by prior knowledge. Another consideration is that beverage intake can be correlated with other risk factors that were not measured in this study. Even though we controlled for all potential confounding factors, residual confounding by unmeasured or imperfectly measured factors may still exist. How representative our findings are is limited by the fact that the participants and their families are health professionals who may practise different lifestyle behaviours that vary from those of the general population. However, we believe our population is representative of the urban population of central Mexico. In this same sense, we cannot rule out the possibility of reverse causality as subjects with a chronic disease (e.g. diabetes) were able to modify their beverage consumption pattern because of their knowledge of the disease or some medical recommendation.
To date, there are no studies that document the association between beverage consumption patterns and CHD. Analysing beverage consumption patterns allows for easy interpretation and a more comprehensive assessment of beverage intake. It can also be translated into dietary recommendations( Reference Hu 18 ). Our findings are relevant because we analysed each beverage group separately, which enabled us to be able to observe independent effects of certain types of beverages on CHD.
In conclusion, among Mexican adults, Alcohol and Low-fat milk patterns were inversely associated with CHD, whereas the soft-drink pattern was positively associated. Our data suggest possible dietary recommendations for preventing CHD in Mexican adults; however, further longitudinal studies in various populations following different beverage patterns are required to confirm these results.
Acknowledgements
The present study was supported by Consejo Nacional de Ciencia y Tecnología CONACYT (grant no. 262233).
B. R.-P. and J. S. were involved in the conception and design of the study; B. R.-P. and P. M.-A. participated in the statistical analysis and interpreted the final data; B. R.-P., P. M.-A., L. T.-I., P. R., R. H.-L., E. B., L. L.-M., E. H., E. D.-G., M. F., E. S.-M. and J. S. drafted the manuscript; all authors reviewed and commented on the manuscript; all authors read and approved the final manuscript.
The authors declare that there are no conflicts of interest.
Supplementary material
For supplementary material/s referred to in this article, please visit https://doi.org/10.1017/S0007114518001411


