


The importance of healthy eating is widely recognised, but many individuals continue to make poor dietary choices( Reference Lim, Vos and Flaxman 1 , Reference Imamura, Micha and Khatibzadeh 2 ), indicating that factors other than consideration of health and nutrition influence people’s dietary choice( Reference Glanz, Basil and Maibach 3 , Reference Kearney, Kearney and Dunne 4 ). Food cost is suggested to play an important role in determining people’s decisions regarding food purchase and consumption( Reference Glanz, Basil and Maibach 3 , Reference Kearney, Kearney and Dunne 4 ). Evidence indicates that healthy diets cost more than unhealthy diets( Reference Drewnowski 5 – Reference Conklin, Monsivais and Khaw 9 ). A recent meta-analysis reported that a diet rich in fruits, vegetables and nuts was on average USD$1·50 more expensive per d compared with a diet of processed foods, meats and refined grains( Reference Rao, Afshin and Singh 8 ). Dietary cost could thus be a barrier to adopting a healthy diet, particularly amongst individuals of lower socio-economic status( Reference Marmot and Brunner 10 ). This socio-economic gradient in diet quality could in turn contribute to disparity in health amongst different socio-economic groups( Reference Rehm, Monsivais and Drewnowski 11 ).
One example of a healthy diet is the Mediterranean diet, based on the traditional diets of Mediterranean regions( Reference Willett, Sacks and Trichopoulou 12 ). The Mediterranean diet is characterised by the use of olive oil as the main source of fat; high consumption of vegetables, legumes, fish; moderate consumption of fruits, cereals, nuts, eggs, dairy products, white meat, wine; and low consumption of red meat, processed meat, potatoes and sweets( Reference Bach-Faig, Berry and Lairon 13 ). This dietary pattern has been associated with lower risk of many non-communicable diseases in both Mediterranean and non-Mediterranean countries( Reference Sofi, Macchi and Abbate 14 – Reference Tong, Wareham and Khaw 20 ). Based on the available evidence, some governmental and academic agencies recommend this dietary pattern to a general population for the primary and secondary prevention of non-communicable diseases( Reference Bach-Faig, Berry and Lairon 13 , 21 , 22 ). In addition, adherence to this dietary pattern has reportedly increased over the past decades in some non-Mediterranean countries( Reference da Silva, Bach-Faig and Raido Quintana 23 ).
Although the health benefits of adhering to the Mediterranean diet have been demonstrated, evidence of affordability or dietary cost associated with this diet is limited, especially in non-Mediterranean settings. In total, three population-based studies in Mediterranean countries( Reference Lopez, Martinez-Gonzalez and Sanchez-Villegas 6 , Reference Schröder, Marrugat and Covas 24 , Reference Vlismas, Panagiotakos and Pitsavos 25 ) showed higher cost of the Mediterranean diet pattern; while two short-term small-scale trials showed conflicting results of greater cost in a Swedish trial( Reference Rydén, Sydner and Hagfors 26 ), but not in a trial of healthy Canadian women( Reference Goulet, Lamarche and Lemieux 27 ). To our knowledge, no population-based study on the monetary cost of the Mediterranean diet has been published in non-Mediterranean countries. Moreover, evidence is lacking on whether there is a consistent association across different socio-economic strata, even though socio-economic status influences purchasing behaviours related to food prices( Reference Monsivais, Aggarwal and Drewnowski 28 , Reference Aggarwal, Monsivais and Cook 29 ). Therefore, we set two aims in this study. First, we aimed to examine the dietary cost associated with adhering to the Mediterranean diet in the United Kingdom. Second, we aimed to assess the extent to which this association is influenced by socio-economic factors.
Methods
Study population
The Fenland Study is a population-based cohort study of 12 435 participants recruited from general practices in Cambridgeshire (Cambridge, Ely, Wisbech) from 2004 to 2015( Reference De Lucia Rolfe, Loos and Druet 30 ). The Fenland Study was designed to investigate genetic and environmental factors that interact to determine obesity, type 2 diabetes and related metabolic traits. For recruitment into the Fenland Study, participants were eligible if born between 1950 and 1975 (age 30–65 years at recruitment), and exclusion criteria included pregnancy, known diabetes, an inability to walk unaided, psychosis and terminal illness. Participants visited one of the three study centres for a health visit during which they completed a FFQ and a general health and lifestyle questionnaire. Trained staff collected blood samples and anthropometric measures. The study was approved by the Health Research Authority NRES Committee East of England-Cambridge Central and all participants gave written informed consent.
Dietary assessment
Dietary assessment was based on a 130-item semi-quantitative FFQ, which asked about dietary intake over the past year. Participants reported intake frequencies of dietary consumption in a standard food portion, ranging from ‘never or less than once/month’ to ‘6+ per day’ across nine categories. Further questions elicited information regarding milk intake, type of breakfast cereal, type of fat most often used for cooking and dietary habits including use of dietary supplements. Information from the FFQ was processed to estimate daily intakes based on standard portion sizes and the UK food composition database using the FETA software( Reference Mulligan, Luben and Bhaniani 31 ). The FFQ has been previously validated against 16-d weighed records, 24-h recall and selected biomarkers( Reference Bingham, Gill and Welch 32 ). Dietary intakes were adjusted to 8·37 MJ/d (2000 kcal/d) using the residual method, to reduce confounding by total energy intake and to examine diet quality independent of quantity( Reference Hu, Stampfer and Rimm 33 ).
We assessed adherence to the Mediterranean diet using a Mediterranean diet score (MDS) which we derived based on recommendations (the Mediterranean diet pyramid) by the Mediterranean Diet Foundation( Reference Bach-Faig, Berry and Lairon 13 ). High adherence to this MDS has been shown to be associated with lower risk of CVD in a UK population, and details of the scoring criteria have been described previously( Reference Tong, Wareham and Khaw 20 ). In brief, we derived fifteen dietary components from the recommendations (vegetables, legumes, fruits, nuts, cereals, dairy products, fish, red meat, processed meat, white meat, egg, potatoes, sweets, olive oil and alcohol); and assigned scores of 0–1 for each component according to the participant’s level of adherence with each recommended intake. The MDS has a possible range of 0–15, and measures Mediterranean diet adherence with adjustment to a 8·37 MJ/d (2000 kcal/d) diet.
Dietary cost
Dietary cost of Fenland participants was estimated by attaching a food price variable to each of the 290 food codes in the FFQ’s food and nutrient database, using previously described methods( Reference Monsivais, Perrigue and Adams 34 – Reference Monsivais and Drewnowski 37 ). In brief, retail prices were matched in June 2012 using prices on MySupermarket.co.uk, a website for comparing prices across UK supermarkets. In total, five supermarkets were represented (Tesco, Sainsbury’s, Asda, Waitrose, Ocado) on the website at the time of data collection, which together had 68 % of the market share in 2012( Reference Monsivais, Scarborough and Lloyd 35 ). The lowest, non-sale price listed on the website was matched for each item in the FFQ database, which was subsequently adjusted for preparation and waste to yield an adjusted food price (£) per 100 g of the edible portion, using established methods( Reference Monsivais and Drewnowski 36 – Reference Monsivais, Rehm and Drewnowski 38 ). Similar to dietary intake, dietary cost was adjusted to a 8·37 MJ/d diet (2000 kcal/d) using the residual method( Reference Hu, Stampfer and Rimm 33 ). Total daily dietary cost and cost for each Mediterranean diet component were then summarised for each participant. Cost for adhering to the Mediterranean diet was also summarised, which was defined as the combined cost of the fifteen food components of the MDS. In addition, cost of the rest of the diet was defined as the total daily dietary cost minus cost for adhering to the Mediterranean diet.
Assessment of socio-economic variables and lifestyle covariates
Social and economic characteristics of Fenland participants were ascertained from the general health and lifestyle questionnaire. Variables of interest included education level, marital status, occupation and household income. Education level was assessed with questions regarding thirteen types of British education certificates, and responses were classified into three categories as compulsory, further or higher education. Marital status was classified into single, married or other. Occupation was assessed by eight possible occupation types and classified into two categories, managerial/professional and routine/technical/others. Equivalised household income for each Fenland participant was calculated based on their reported total household income, taking into account the number of people in the household using previously published methods( Reference Anyaegbu 39 , Reference Maguire and Monsivais 40 ). Test site location (Cambridge, Ely, Wisbech) at which the participants attended for the clinical visit was also considered as an area-based socio-economic status variable. Of the three sites, 41 % of participants in Cambridge had an equivalised household income of the highest category (>£44 776), and the equivalent figures were 32 % in Ely and 23 % in Wisbech. Therefore, across the three sites, Cambridge was the least deprived, followed by Ely, and Wisbech was the most deprived.
Information on smoking behaviour was also collected in the same questionnaire. Physical activity energy expenditure was objectively assessed over 6 d using individually calibrated combined heart rate and movement sensing( Reference Brage, Westgate and Franks 41 ). Weight and height were measured following standardised procedures and used to calculate BMI (kg/m2).
Statistical analyses
We used descriptive statistics to summarise the characteristics of participants by adherence to the Mediterranean diet, as assessed using the MDS. To assess the association of the MDS with total daily dietary cost, we estimated the linear association for per unit difference in dietary cost for thirds (tertiles) and per sd of the MDS. We adjusted for potential confounders including age, sex, socio-economic status (test site, education level, occupation, household income, marital status), physical activity, BMI and smoking. To check robustness of our result, we tested for the association using an alternative validated MDS (tMDS) with a possible range of 0–18( 42 ). Furthermore, across the three categories of the MDS, we estimated the adjusted geometric means, absolute difference and relative difference of total daily dietary cost and cost of each of the fifteen Mediterranean diet components. For these estimations, linear regressions were used for assessing total dietary cost, cost of adherence and cost of rest of diet. In analysis of each of the fifteen dietary components, Poisson regression was used for estimating cost associated with each of the fifteen components to account for the positively skewed distribution of each variable.
To assess the extent to which socio-economic factors influenced the association between Mediterranean diet adherence and dietary cost, we compared β-coefficients from two regression models between per sd of MDS and per unit (£/d) of dietary cost, without (as the reference model) and with socio-economic factors fitted (β reference and β reference+factor(s) of interest, respectively) as conducted elsewhere( Reference Stringhini, Tabak and Akbaraly 43 ). In brief, we calculated the percentage attenuation between the two regression models as ‘100×(β reference−β reference+factor(s) of interest)/β reference’( Reference Stringhini, Tabak and Akbaraly 43 ). 95 % CI for the percentage attenuations were estimated by undertaking bootstrapping (n resampling=5000)( Reference Stringhini, Tabak and Akbaraly 43 , Reference Efron 44 ). This analysis of attenuation was assumed to have no interaction between the variable of interest and MDS. We therefore tested interaction and stratified analyses of Mediterranean diet adherence and dietary cost, by strata of socio-economic variables by fitting a cross-product interaction term in multivariable-adjusted linear regression for each socio-economic variable (categorical) and MDS (continuous). For each variable showing a significant interaction, we assessed contribution of other socio-economic factors to the association of MDS and dietary cost by strata of the interacting variable.
Missing information on covariates was accounted for by conducting multiple imputation (ten imputed data sets) and pooling estimates with Rubin’s rule( Reference White, Royston and Wood 45 ). The adjusted geometric means, absolute and relative difference, and mediation analysis involving bootstrapping used a single imputed data set after confirming little difference between single- and multiple-imputation results. All analyses were performed in Stata 14.0 (StataCorp LP). P-values<0·05 were considered significant.
Results
Cohort characteristics
After excluding eighteen participants without data from FFQ, 12 417 participants were included for analyses (mean age, 48·6 (sd 7·5) years; 53·8 % women). The participants’ characteristics and the MDS by strata of cohort characteristics are presented in Table 1. Dietary consumption levels (servings/d) of MDS components are presented in the online Supplementary Table S1. Mean of MDS was 9·0 (sd 1·4). MDS was higher in participants who attended the Cambridge site, were women, more educated, had higher household income, of managerial or professional occupation, were not current smokers, not on antihypertensive medication or had low CVD risk. Marital status was not related to the MDS.
Table 1 Cohort characteristics and Mediterranean diet adherence in the Fenland Study (Mean values and standard deviations; n 12 417)
* For all variables, P-values were estimated based on crude linear regression of Mediterranean diet score (fitted as continuous variable) and each cohort characteristic. For age, energy intake, energy expenditure and BMI, the P-value represents significance of its association between Mediterranean diet adherence. For the other cohort characteristics, the P-value represents significance in heterogeneity of Mediterranean diet adherence across strata of cohort characteristics.
† Of the three sites, Cambridge was the least deprived, followed by Ely, and Wisbech was the most deprived.
‡ Compulsory includes ‘school leaving certificate’, ‘CSE’, ‘GCE O level or GCSE’; Further includes ‘matriculation’, ‘GCE A level, AS level, highers’, ‘technical college exams, city and guilds’, ‘HND GNVQ’, ‘completed apprenticeship’, ‘secretarial college exams’, ‘teaching diploma, HNC, NVQ’, ‘trade certificates’; Higher includes ‘university degree’.
§ Other included widowed, separated or divorced.
‖ Routine/tech/others included clerical, technical, semi-routine and routine jobs; Manager/professional included modern professional, senior manager, middle management and traditional professional jobs.
¶ Cardiovascular risk score for 10 year risk of CVD.
Association of Mediterranean diet and dietary cost
High adherence to the Mediterranean diet was associated with higher dietary cost, and results were similar across all levels of adjustment (Table 2, online Supplementary Fig. S1). On average, high Mediterranean diet adherence (adjusted mean dietary cost: £4·47; 95 % CI 4·44, 4·49) was associated with a £0·20 price difference per d (95 % CI 0·16, 0·24) compared with low adherence (adjusted mean dietary cost: £4·26; 95 % CI 4·23, 4·29) in the most adjusted model, equivalent to 5·4 % (95 % CI 4·4, 6·4) in relative terms (Fig.1). Results were similar when we used an alternative MDS (tMDS)( 42 ), which showed an adjusted mean dietary cost of £4·69 (95 % CI 4·66, 4·71) for high adherence compared with £4·08 (95 % CI 4·05, 4·11) for low adherence.
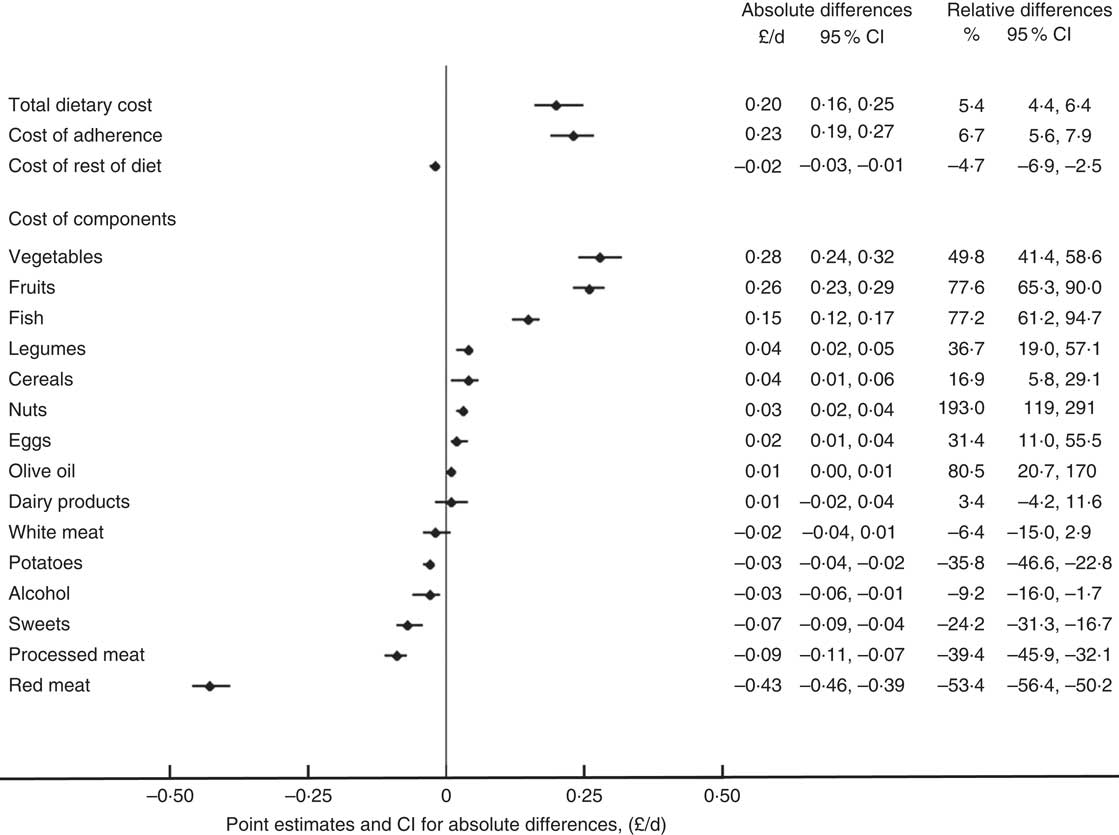
Figure 1 Absolute and relative differences in cost of total diet and dietary components comparing high (top third) and low adherence (bottom third) to the Mediterranean diet in the Fenland Study. Point estimates and CI shown are for absolute differences. All estimates based on single imputed dataset, after confirming no difference in β-coefficients between single and multiple (ten) imputations. Cost of adherence refers to total cost for all components included in the score of adherence to the Mediterranean diet (i.e. sum of dietary components listed); cost of rest of diet refers to any food items not included in the adherence score.
Table 2 Difference (£/d) in dietary cost by Mediterranean diet adherence in the Fenland Study (β-Coefficients and adjusted means and 95 % confidence intervals; n 12 417)Footnote *
Ref., referent values.
* Daily dietary cost and dietary intake adjusted to a 8368 kJ/d (2000 kcal/d) diet using the residual method. Estimates shown are β-coefficients from linear regression estimated based on ten multiple imputations.
† Model 1 is adjusted for age and sex; model 2 is additionally adjusted for test site, education level, occupation, household income, marital status; model 3 is additionally adjusted for BMI, objectively measured physical activity (energy expenditure) and smoking status. Adjusted means of dietary cost estimated based on model 3 and on single imputed data set, after confirming no difference in β-coefficients between single and multiple (ten) imputations.
At the cohort level, participants who had a high MDS had higher dietary cost associated with consumption of food components representative of the Mediterranean diet, including vegetables, legumes, fruits, nuts, fish, eggs, cereals and olive oil. The largest absolute cost difference when comparing extreme thirds was associated with vegetables (£0·28/d; 95 % CI 0·24, 0·32) and fruit consumption (£0·26; 95 % CI 0·23, 0·29). On the other hand, high Mediterranean diet adherence was also associated with lower diet cost relating to consumption of red meat, processed meat, potatoes, alcoholic beverages and sweets, with the biggest negative cost difference attributed to red meat consumption (−£0·43; 95 % CI −0·46, −0·39). No statistically significant cost difference in dairy products or white meat consumption was found between high and low adherence to a Mediterranean diet. Multivariable-adjusted dietary cost of the overall Mediterranean diet and individual dietary component by thirds of MDS are presented in the online Supplementary Table S2.
In assessing the influence of socio-economic variables, education, income, marital status and occupation were found to partially explain the observed association between Mediterranean diet adherence and dietary cost (Table 3). Among the individual variables, occupation explained the greatest variation in the observed association (15·8 %; 95 % CI 11·5, 20·5), followed by income (15·0 %; 95 % CI 11·4, 18·6). All tested variables collectively explained 20·7 % (95 % CI 14·3, 27·0) of the observed association.
Table 3 Contribution of socio-economic factors in explaining the association between Mediterranean diet adherence and daily dietary cost in the Fenland Study (β-Coefficients and 95% confidence intervals; n12 417)
* β-Coefficients from linear regression for daily dietary cost (£/d) per sd of Mediterranean diet score estimated based on ten imputations.
† Percentage difference in β-coefficients comparing tested model to reference model (estimated from 5000 bootstrap samples) based on one of the ten imputations. A positive value indicates attenuation.
‡ Adjusted for age, sex, objectively measured physical activity (energy expenditure), smoking status and BMI.
In assessing potential interaction between MDS and socio-economic variables, significant interaction was observed for test site, education, income and occupation (P for interaction<0·005 for each) (Table 4). No significant association between MDS and dietary cost was observed among population groups that were the most highly educated or not married (i.e. single or others, including widowed, separated or divorced), and a lower magnitude of association was observed among those who visited the Cambridge test site, had the highest household income, or of managerial or professional occupations. The contribution of socio-economic factors in explaining the association between MDS and dietary cost by strata of the interacting socio-economic variables are presented in the online Supplementary Table S3.
Table 4 Association between adherence to the Mediterranean diet and dietary cost by socio-economic characteristics in the Fenland Study (β-Coefficients and 95 % confidence intervals; n 12 417)Footnote *
Ref., referent values.
* β-Coefficients from linear regression for daily dietary cost (£/d) by adherence to the Mediterranean dietary pyramid estimated based on ten imputations. Daily dietary cost and dietary intake were adjusted to a 8368 kJ/d (2000 kcal/d) diet using the residual method. All estimates were adjusted for age, sex, objectively measured physical activity (energy expenditure), smoking status and BMI, and for socio-economic variables including education level, household income, marital status, test site and occupation, with exception for the stratified variable. Strata were defined based on non-imputed data.
† Based on Mediterranean diet adherence modelled as a continuous variable and socio-economic variables modelled as categorical variables. Estimation was based on one of the ten imputed datasets after confirming little difference across data sets.
‡ Of the three sites, Cambridge was the least deprived, followed by Ely, and Wisbech was the most deprived.
§ Compulsory includes ‘school leaving certificate’, ‘CSE’, ‘GCE O level or GCSE’; Further includes ‘matriculation’, ‘GCE A level, AS level, highers’, ‘technical college exams, city and guilds’, ‘HND, GNVQ’, ‘completed apprenticeship’, ‘secretarial college exams’, ‘teaching diploma, HNC, NVQ’, ‘trade certificates’; Higher includes ‘university degree’.
‖ ‘Other’ marital status included widowed, separated or divorced.
¶ Routine/tech/others included clerical, technical, semi-routine and routine jobs; Manager/professional included modern professional, senior manager, middle management, traditional professional jobs.
Discussion
Key findings
In this large population-based Fenland Study, high adherence to the Mediterranean diet was associated with a modest degree (5·4 %) of higher dietary cost. Compared with low Mediterranean diet adherence, participants who had a high adherence typically had higher dietary cost associated with consumption of food components traditionally marked as healthy (e.g. vegetables, legumes, fruits, nuts, fish, cereals and olive oil) in this dietary pattern, but lower dietary cost associated with food components traditionally marked as unhealthy (e.g. red and processed meat, potatoes and sweets). For those dietary components for which moderate consumption was recommended, the difference in dietary cost comparing high to low adherence could be slightly higher (e.g. eggs), slightly lower (e.g. alcohol) or not significantly different (e.g. dairy products, white meat). Socio-economic status partially explained the observed association between Mediterranean diet adherence and dietary cost, and significant interaction was observed between Mediterranean diet adherence and test site, education, income and occupation.
Comparison with other studies
Although some previous studies examined the association between the Mediterranean diet and dietary cost, our study was the first to demonstrate the extent to which socio-economic factors contribute to this association. Our results were broadly consistent with some published studies on the Mediterranean diet and dietary cost( Reference Lopez, Martinez-Gonzalez and Sanchez-Villegas 6 , Reference Schröder, Marrugat and Covas 24 – Reference Goulet, Lamarche and Lemieux 27 ). But, our estimate of cost difference by adherence to the diet was smaller than estimates on average in most of the previous studies. For example, estimates based on comparing high with low adherence to the Mediterranean diet in Spain was £0·5/d or greater (crude percentage difference 18 and 28 %)( Reference Lopez, Martinez-Gonzalez and Sanchez-Villegas 6 , Reference Schröder, Marrugat and Covas 24 ), whereas our estimate showed £0·2/d (5·4 %).
Outside of the Mediterranean region, a small (n 30) trial in Sweden compared between the daily 8368-kJ (2000-kcal) dietary costs of the Mediterranean diet and the usual Swedish diet( Reference Rydén, Sydner and Hagfors 26 ). The authors reported that the average cost difference was €1·45 (sd 0·10) (24 %, or equivalent to £1·29 as of 26 July 2017) per d( Reference Rydén, Sydner and Hagfors 26 ). In contrast, a trial (n 73) among women in Canada reported no significant change in total daily dietary cost following a 12 week Mediterranean diet intervention: 8·61 CAN$ (£5·27) before intervention and 8·75 CAN$ (£5·36) after intervention (P=0·58)( Reference Goulet, Lamarche and Lemieux 27 ). Overall, there is inconsistency in existing evidence, study populations, and methods to assess the association or effect, as well as no prior evidence for the effect modified by underlying socio-economic diversity. Therefore, whether or not the Mediterranean diet costs more than a usual diet remains inconclusive.
Two studies of existing literature reported contribution of the components of the Mediterranean diet to dietary cost, and both were consistent with our findings. The trial of women in Canada found that the Mediterranean diet intervention increased cost related to consumption of healthy components (e.g. vegetables, fish, nuts and seeds, canola or olive oil), and reduced cost related to consumption of unhealthy components (e.g. red meat, refined grains, fast food)( Reference Goulet, Lamarche and Lemieux 27 ). Similarly, the trial in Sweden found higher costs associated with consumption of fish, vegetable, and poultry and lower cost associated with the consumption of meat and desserts in the Mediterranean diet intervention group compared with the control group( Reference Rydén, Sydner and Hagfors 26 ), and one observational study in Spain also showed similar results if adherence to the Mediterranean diet was higher( Reference Schröder, Marrugat and Covas 24 ).
The observed positive association between Mediterranean diet adherence and socio-economic status is consistent with other evidence from adult populations in both Mediterranean( Reference González, Argilaga and Agudo 46 ) and non-Mediterranean countries( Reference Marques-Vidal, Waeber and Vollenweider 47 ). With exception, a study in Portugal reported an inverse association in that people of higher socio-economic status had lower Mediterranean diet adherence( Reference Rodrigues, Caraher and Trichopoulou 48 ). However, as the authors acknowledged, this is likely reflective of the current phase of the nutrition transition in Portugal, during which urbanisation and increased income levels are linked to higher intakes of animal products or processed foods( Reference Rodrigues, Caraher and Trichopoulou 48 , Reference Popkin 49 ). No study was found which simultaneously examined dietary cost of a Mediterranean diet and how this association varied by socio-economic status.
Interpretation of findings and implications
Our results indicate that in this non-Mediterranean cohort, high adherence to the Mediterranean diet, based on an MDS previously shown to be associated with lower CVD risk( Reference Tong, Wareham and Khaw 20 ), was associated with higher dietary cost, but the degree of cost difference was modest compared with previous studies( Reference Lopez, Martinez-Gonzalez and Sanchez-Villegas 6 , Reference Schröder, Marrugat and Covas 24 , Reference Rydén, Sydner and Hagfors 26 ). In addition, there was negligible difference in dietary cost associated with consumption of items not included in the MDS (i.e. cost of rest of diet: Fig. 1 and online Supplementary Table S3). Therefore, the observed cost difference was mainly associated with differential costs across Mediterranean diet components. As discussed above, individuals with low adherence to the Mediterranean diet had higher cost associated with unhealthy food items such as red meat and processed meat. This gives rise to the possibility of increasing adherence to the Mediterranean diet on an individual level without increasing cost, by substituting spending on unhealthy items for more healthy items( Reference Jones, Tong and Monsivais 50 ). The feasibility of this approach is supported by evidence from the trial in Canada( Reference Goulet, Lamarche and Lemieux 27 ). Moreover, although our work did not include details within each food group, increasing adherence to the Mediterranean diet might also be achieved by increasing consumption of the cheaper healthy components, or lower cost options of the more expensive components, such as by increasing consumption of pulses, legumes, dried fruit and canned fish( Reference Drewnowski and Eichelsdoerfer 51 ). Overall, our results from this UK population suggest that adopting a Mediterranean diet could potentially be a financially feasible way of achieving a healthy diet. Methods of diet optimisation modelling or linear modelling could be employed to model possible ways of increasing Mediterranean diet adherence at any given cost( Reference Maillot and Drewnowski 52 – Reference Wilson, Nhung and Mhurchu 54 ).
Our results suggest that socio-economic factors explained about 22 % of the association between Mediterranean diet adherence and dietary cost. This supports the hypothesis that socio-economic status could be related to both dietary behaviour and dietary spending habits( Reference Pechey and Monsivais 55 ). Results from our stratified analyses showed non-significant or lower magnitudes of associations between the dietary adherence and dietary cost among individuals with relatively high socio-economic status. This suggests that amongst people of a high socio-economic status, dietary cost is less likely to be associated with, or influence their adherence to a Mediterranean diet compared with people of lower socio-economic status. This in turn supports the notion that high dietary cost is more likely to be a barrier against adopting a healthy diet amongst people of lower socio-economic status( Reference Mackenbach, Brage and Forouhi 56 , Reference Green, Cornelsen and Dangour 57 ).
Our observed difference by £0·20/d (approximately equivalent to £6·10 (95 % CI 4·90, 7·30) cost difference per month or £73·20 (95 % CI 58·80, 87·60) per year) between extreme thirds of the adherence measure appears modest compared with both other studies on the Mediterranean diet as described, as well as other studies on alternative indexes of dietary quality in the United Kingdom( Reference Conklin, Monsivais and Khaw 9 , Reference Monsivais, Scarborough and Lloyd 35 ), therefore suggesting that the Mediterranean dietary pattern may be a relatively affordable option of a healthy diet in this country. However, the relevance of this magnitude of difference to a real world setting deserves further discussion. In our analyses, we estimated the cost difference adjusted to a 8368 kJ/d (2000 kcal/d) diet, in order to assess the cost difference associated with a difference in diet quality independent of quantity( Reference Hu, Stampfer and Rimm 33 , Reference Monsivais, Perrigue and Adams 34 ). In this study, participants in the lowest third of adherence to a Mediterranean diet had an average energy intake of 8887 kJ/d (2124 kcal/d), compared with 7766 kJ/d (1856 kcal/d) among participants in the top third of adherence, which is in line with other evidence that healthier diets are less energy dense( Reference Murakami and Livingstone 58 ). Therefore, if an increased adherence to a Mediterranean diet is simultaneously associated with a decrease in total energy in a natural setting, the cost difference reported in this study may be an overestimation of the real cost difference( Reference Jones, Tong and Monsivais 50 ). Also, the calculation of dietary cost in this study made the assumption that all meals were prepared and consumed at home, and did not factor in the higher costs associated with out-of-home meals. As a result, the true monetary value of a Mediterranean diet in the UK remains to be determined.
Regardless of the true cost difference, the greater magnitude of cost difference observed among people of lower socio-economic status could in turn accentuate the existing socio-economic disparity in health( Reference Dalstra, Kunst and Borell 59 , Reference Elgar, Pförtner and Moor 60 ), but it remains unclear whether or not this magnitude of difference is meaningful for individuals or public health in the United Kingdom or elsewhere. Previous studies have shown that dietary interventions may be cost-effective strategies for reducing medical costs associated with non-communicable diseases( Reference Zhang, Cogswell and Wang 61 , Reference Saulle, Semyonov and La Torre 62 ). For the US and Canadian populations, cost-effectiveness of adherence to the Mediterranean diet has been supported by modelling the dietary adherence and medical expenditure due to CVD( Reference Abdullah, Jones and Jones 63 ), and research from Australia( Reference Dalziel and Segal 64 ) and France( Reference Dalziel, Segal and de Lorgeril 65 ) also reported that a Mediterranean diet is cost-effective for prevention of diabetes and secondary prevention of myocardial infarction. Similar work in other countries is warranted accounting for cultural acceptance of the Mediterranean diet across different socio-economic groups, and population-specific burdens of various non-communicable diseases.
Apart from the overall dietary pattern, our work highlights the importance of focusing on individual food groups to achieve a healthy diet pattern in an economic context. There is a compelling case that public health policies should play key roles in controlling subsidies, taxation and other strategies to improve diet quality( Reference Eyles, Ni Mhurchu and Nghiem 66 , Reference Powell, Chriqui and Khan 67 ), in particular for those with relatively low socio-economic status. The potential effectiveness of these policies can be justified by trial evidence which showed that price reduction on healthy dietary components increased consumption of these dietary components( Reference French, Story and Jeffery 68 , Reference French, Jeffery and Story 69 ). Our work additionally raises the possibility that adherence to the Mediterranean diet could be improved without increases in dietary cost. Therefore, recommendation of and facilitating adherence to a Mediterranean diet may help improve public health at the population level by providing dietary guidelines on substituting healthy alternatives for unhealthy food items to overcome economic barriers.
Strengths and limitations
Our study has the advantage of being large, population-based, and it represents a contemporary cohort with price data collected during a matching period, which makes findings relevant to the current UK population. A healthy cohort bias could exist however, given the Fenland cohort has lower prevalence of smoking and obesity compared with the general UK population( 70 , 71 ), and thus might limit the generalisability of findings. Since price data were derived from supermarket prices, this may not reflect real expenditure nor take into account any variation in prices due to region, time of year or type of establishment from which the participants made their purchase( Reference Lopez, Martinez-Gonzalez and Sanchez-Villegas 6 ). In addition, because price data was collected at one time point in 2012 while food intake information was collected from 2004 to 2015, we have not accounted for possible changes in dietary intake over the years as a result of inflation, or price changes associated with particular food items. Surrogate categorical variables of socio-economic status were also used in our analyses, which might not fully capture socio-economic variation in the population. Since both the MDS and dietary cost were derived from the same FFQ, we cannot rule out the possibility that some level of association might be artefactual. Due to the structure of the FFQ, details in dietary intake such as culinary methods (e.g. cooking or food preparation) or type of product consumed (e.g. cut of meat, or organic and non-organic products) was not captured, although such differences may be relevant to both Mediterranean diet adherence and dietary cost. Because this study adopted a cross-sectional design and entails residual confounding, we cannot infer any causal association between increasing Mediterranean diet adherence and dietary cost.
Conclusions
High adherence to the Mediterranean diet was associated with marginally higher dietary cost in a large UK population, although strength of association differed by socio-economic status. Our findings provide evidence that although higher cost associated with healthy diets could be a barrier against healthy eating, especially among people of lower socio-economic status, savings could be made by reducing consumption of food components not representative of the Mediterranean diet. These findings should prompt debate on public health interventions to help lower dietary costs associated with healthy diets and also to guide the public to recognise feasibility of improving certain dietary habits without substantial financial burden, which could in turn help improve overall dietary patterns and tackle the issues of socio-economic disparities in health.
Acknowledgements
The authors thank all the Fenland Study volunteers for their time and participation, as well as the Fenland Study Co-ordination team, the Field Epidemiology team, the data management team and the laboratory team.
The Fenland Study is funded by the Medical Research Council. Support from Medical Research Council core programmes MC_UU_12015/1 and MC_UU_12015/5 is acknowledged.
S. B., N. G. F., S. J. G. and N. J. W. acquired the data as Fenland Study principal investigators, with N. J. W. as chief investigator. T. Y. N. T., F. I., P. M. and N. G. F. conceived and designed the research question. T. Y. N. T. analysed the data and wrote the first draft of the manuscript, and F. I., P. M. and N. G. F. provided input on data analysis and interpretation of results. All authors revised the manuscript critically for important intellectual content, and read and approved the final manuscript.
The authors declare that there are no conflicts of interest.
Supplementary Material
For supplementary material/s referred to in this article, please visit https://doi.org/10.1017/S0007114517003993


 Open access