


Skeletal muscle protein deposition requires both amino acids and energy, especially as glucose( Reference Jeyapalan, Orellana and Suryawan 1 ). Consequently, the balance of protein and energy at sites of protein synthesis is critical for efficient net protein deposition. Dietary protein provides amino acids and some energy; the balance is derived from the starch and lipid components. Vegetable and animal protein meals, feed grains and an increasing array of synthetic amino acids constitute dietary protein. Dietary starch is the dominant energy source and the majority of starch is derived from feed grains (maize, wheat, barley, sorghum). Nevertheless, it is necessary to include lipid, such as tallow or vegetable oil to meet recommended dietary energy densities despite the relatively high cost of these feed ingredients. Weight gains of broiler chickens are largely determined by the quantity of feed consumed despite the importance of dietary nutrient density and their bioavailability. Both dietary protein concentrations and energy densities influence feed intakes and, consequently, growth performance of broiler chickens. An earlier investigation( Reference Liu, Selle and Raubenheimer 2 ) found that protein is more important than starch and lipids for weight gain in broiler chickens offered isoenergetic diets, and the balance of protein and energy is pivotal for optimal feed efficiency. However, sub-standard growth performance was observed in that study because broiler chickens were offered powdery, mash diets. The first aim of the present study is, therefore, to further examine the previous findings using cold-pelleted diets, to test the responses in the context of greater feed intakes.
Apparent metabolisable energy (AME) is widely used in practice to gratify the availability of energy in feed and feed ingredients for maintenance and growth of animals. However, AME does not account for the heat increment of feeding; therefore, it cannot distinguish between two feeds with the same AME content but differing in their chemical composition such that the increase in heat production from feeding differs between the two( Reference Gous 3 ). Emmans( Reference Emmans 4 ) suggested that, in monogastric animals, the heat increment of feeding is considered to be linearly related to urinary N, faecal organic matter and positive protein retention. The authors also suggested effective energy (EE) as a refinement to the existing AME system to take into account losses accompanying energy utilisation derived from protein. Diets in the present study were formulated to contain identical EE values (12·05 MJ/kg), although formulated energy densities expressed as AME ranged from 12·97 to 13·82 MJ/kg. Experimental diets contained five graded levels of dietary protein, ranging from 123 to 338 g/kg, and the dietary treatments were based on maize, soyabean meal, isolated soya protein and casein with similar EE densities. Gous et al. ( Reference Gous, Wessels and Saunders 5 ) reported that when broiler breeder pullets were offered isoenergetic diets with different protein concentrations, energy consumption increased with decreasing dietary protein concentrations and the majority of the increased energy was derived from lipids. The second aim of the present study is, therefore, to compare these dietary treatments in the context of low and high dietary lipid levels of 40 and 75 g/kg. The primary objective was to investigate the responses of growth, nutrient utilisation and carcass composition to dietary protein and lipid concentrations, to improve prediction of performance responses to diet in broiler chickens.
Methods
Diet preparation
The feeding study comprised ten dietary treatments based on maize, soyabean meal, isolated soya protein, casein, synthetic amino acids, sunflower oil and other minor ingredients. All the diets were formulated to an EE density( Reference Gous 3 , Reference Emmans 4 ) in the order of 12·05 MJ/kg with five levels of protein concentrations (range of formulated mean values: 123, 177, 230, 284 and 338 g/kg) and two levels of lipid concentrations (40 and 75 g/kg). The diets with the same lipid concentrations were formulated to contain five levels of protein as stated and five starch to protein ratios (4·3, 2·8, 2·0, 1·5 and 1·1 g/g). The details of diet compositions and calculated nutrient specifications in the dietary treatments are shown in Table 1. The analysed dietary nutrient compositions are also included in Table 1 and the statistical regressions were based on analysed dietary nutrient compositions. Maize was hammer-milled through a 3·2-mm sieve screen before being mixed with the other ingredients and the diets were then cold-pelleted and crumbled. Acid-insoluble ash (AIA) (CeliteTM; World Minerals) was included in the diets at 20 g/kg as an inert marker to determine nutrient digestibility coefficients at the distal jejunum and distal ileum at 28 d post-hatch.
Table 1 Diet compositions and calculated nutrient specifications in experimental diets for broiler chickens from 7 to 28 d post-hatch
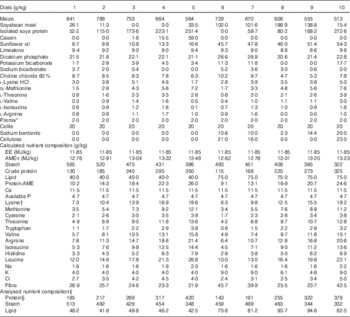
EE, effective energy; AME, apparent metabolisable energy; AMEn, N-corrected AME.
* The vitamin–mineral premix supplied per tonne of feed: (mIU) retinol, 12; cholecalciferol, 5; (g) tocopherol, 50; menadione, 3; thiamine, 3; riboflavin, 9; pyridoxine, 5; cobalamin, 0·025; niacin, 50; pantothenate, 18; folate, 2; biotin, 0·2; Cu, 20; Fe, 40; Mn, 110; Co, 0·25; I, 1; Mo, 2; Zn, 90; Se, 0·3.
† Digestible amino acids.
‡ DM basis.
§ Protein concentrations were determined by N content times the factor of 6·25.
Bird management
This feeding study complied with the specific guidelines of the Animal Ethics Committee of the University of Sydney. Male, day-old chicks (Ross 308) were offered a commercial starter diet at 7 d post-hatch. They were then individually identified (wing-tags), weighed and allocated to bioassay cages on the basis of body weight in an environmentally controlled facility. There was no statistical difference in the average body weight for each cage at the beginning of the feeding study. Each of the ten dietary treatments was offered to four replicate cages (six birds per cage) or a total of 240 chicks from 7 to 28 d post-hatch. Broilers had unlimited access to water and feed under a ‘23 h on–1 h off’ lightingregimen for the first 3 d and then under a ‘16 h on–8 h off’ lighting regimen for the remainder of the feeding period. The room temperature was maintained at 32°C for the 1st week, then gradually decreased to 22±1°C by the end of the 3rd week and maintained at the same temperature until the end of the feeding study. Body weight and feed intake were recorded weekly, from which feed conversion ratios (FCR) were calculated. The incidence of dead or culled birds was recorded daily and their body weight was used to adjust FCR calculations.
Sample collection and chemical analysis
Total excreta were collected from 25 to 27 d post-hatch from each cage to determine parameters of nutrient utilisation, including AME, AME:gross energy (GE) ratios (AME:GE), N retention and N-corrected AME (AMEn). Excreta were dried in an air-forced oven for 24 h at 80°C. The GE of diets and excreta was determined by bomb calorimetry using an adiabatic calorimeter (Parr 1281 bomb calorimeter; Parr Instruments Co.). N content of diets and excreta was determined using an N determinator (Leco Corporation).
The jejunum is the major site of glucose and amino acid absorption( Reference Riesenfeld, Sklan and Bar 6 ); therefore, apparent digestibility coefficients of starch and protein were determined in both the distal jejunum and distal ileum. On day 28, all birds were euthanised using an intravenous injection of sodium pentobarbitone, following which the small intestine was removed and digesta samples were collected in their entirety from the distal jejunum and distal ileum. Jejunum and ileum were demarcated by the end of the duodenal loop, Meckel’s diverticulum and the ileo–caecal junction. Digesta samples from birds within a cage were pooled, homogenised, freeze-dried and ground through a 0·5-mm screen. Starch concentration in diets and digesta were determined using a procedure based on dimethyl sulfoxide, α-amylase and amyloglucosidase, as described by Mahasukhonthachat et al. ( Reference Mahasukhonthachat, Sopade and Gidley 7 ). N concentrations and AIA concentrations were determined as outlined by Siriwan et al. ( Reference Siriwan, Bryden and Mollah 8 ). Lipid concentration was determined in duplicate using automated Soxhlet extraction as described by Luque de Castro and Priego-Capote( Reference Luque de Castro and Priego-Capote 9 ). This apparatus uses a combination of reflux boiling and Soxhlet extraction (both assisted by electrical heating) to perform two extraction steps (boiling and rinsing), followed by extractant recovery.
Two birds from each cage whose body weight was close to the cage mean were selected for analysing carcass composition. The carcass was weighed with feathers but without organs to calculate eviscerated carcass yields. Then, the carcass was autoclaved, ground and freeze-dried to analyse for GE, N and lipid concentrations as described previously. Gross energy, protein (N) and lipid concentrations in the carcass were determined on a DM basis.
Calculations
The AME values of the diets were calculated on a DM basis from the following equation:
 $${\rm AME}_{{{\rm diet}}} {\equals} {{\left( {{\rm feed}\,{\rm intake}{\times}{\rm GE}_{{{\rm diet}}} } \right){\minus}\left( {{\rm excreta}\,{\rm output}{\times}{\rm GE}_{{{\rm excreta}}} } \right)} \over {\left( {{\rm feed}\,{\rm intake}} \right)}}.$$
AME:GE ratios were calculated by dividing AME by the GE of the appropriate diets. N contents of diets and excreta were determined using a N determinator and N retentions calculated from the following equation:
 $$\eqalignno{&{\rm Retention} \, \,\left( \,\%\, \right){\equals} \cr \!\!{{\left( {{\rm feed}\,\,\,{\rm intake} {\,\times}{\rm Nutrient}_{{{\rm diet}}} } \right){\minus}\left( {{\rm excreta}\,\,\,{\rm output}{\,\times\,}{\rm Nutrient}_{{{\rm excreta}}} } \right)} \over {\left( {{\rm feed}\,\,\,{\rm intake}{\,\,\times}{\rm Nutrient}_{{{\rm diet}}} } \right)}}{\times\!}100.$$
N-corrected AME (AMEn MJ/kg DM) values were calculated by correcting N retention to zero using the factor of 36·54 kJ/g N retained in the body( Reference Hill and Anderson 10 ). AME intakes (MJ/d DM) were calculated from dietary energy densities and average daily feed intakes over the entire feeding period.
Apparent digestibility coefficients of starch, protein (N) and lipid were calculated from the following equation:
 $$\eqalignno{{\rm Digestibility}&\,{\rm coefficient\,\,}{\equals} \cr&{{\left( {{\rm nutrient}\,/\,{\rm AIA}} \right)_{{{\rm diet}}} {\minus} \left( {{\rm nutrient}\,/\,{\rm AIA}} \right)_{{{\rm digesta}}} } \over {\left( {{\rm nutrient}\,/\,{\rm AIA}} \right)_{{{\rm diet}}} }}.$$
Digestible intakes (g/bird) of starch, protein and lipid were calculated from the following equation:
 $$\eqalignno{ {\rm Digestible}\,{\rm intake}{\,\equals\,} & {\rm total}\,{\rm feed}\,{\rm intake}\cr {\times}{\rm dietary}\,{\rm nutrient}\,{\rm concentration} \cr & {\times}{\rm distal}\,{\rm ileal}\,{\rm digestibility}\,{\rm coefficients}{\rm .} $$
Starch and protein (N) disappearance rates (g/bird per d) were deduced from feed intakes over the final phase of the feeding period from the following equation:
 $$\eqalignno{ &{\rm Nutrient} \,{\rm disappearance}\,{\rm rate}\,{{({\rm g}\,/{\rm bird}\,{\rm per\,d})}} {\equals} \cr & \,{\rm average}\,{\rm daily}\,{\rm feed}\,{\rm intake}\,{{({\rm g}\,/{\rm bird\,per\,d})}} {\times}{\rm dietary}\,{\rm nutrient}\,{{({\rm g}\,/{\rm kg})}} \cr & \,{\times}{\rm nutrient}\,{\rm digestibility}\,{{({\rm apparent}\,{\rm digestibility}\,{\rm coefficient})}} . $$
Ratios of starch to protein disappearance rates in the intestinal segments were calculated as this effectively cancels the potentially confounding influence of feed intake.
Statistical analysis
Experimental data were analysed using JMP® 9.0.0 (JMP Software; SAS Institute Inc.) and response surfaces were generated using R 3.1.3 software. The experimental units were replicate cage means and statistical procedures included ANOVA using the general linear models and a probability level of <5 % was considered to be statistically significant. Linear and quadratic regressions were considered and responses to DM basis-analysed dietary protein concentrations in diets with different lipid content were compared via ANCOVA. In addition, response surface plots (Fig. 2 and 3) were constructed so that the effects from changing factor levels on the examined responses may be visualised; the plots were generated using generalised additive models with thin-plate regression splines as the smoothing function. In addition, linear and quadratic regressions were considered when appropriate.
Results
The influence of dietary protein and lipid concentrations on growth performance in broiler chickens from 7 to 28 d post-hatch is shown in Table 2. The overall mortality rate during the experimental period was 6·25 %, which was influenced by dietary treatment (P=0·001). Broiler chickens offered diet 10, which had higher lipid concentration and the lowest starch to protein ratio, had a significantly higher mortality rate (37·5 %) than the balance of the experimental diets.
Table 2 Effects of dietary treatments on growth performance in broiler chickens from 7 to 28 d post-hatch
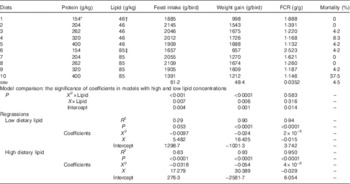
FCR, feed conversion ratio.
* Average analysed dietary protein concentrations in the two diets containing similar starch to protein ratio. For example, 154 g/kg was derived from analysed protein concentration of 165 g/kg in diet 1 and 143 g/kg in diet 6.
† Average analysed dietary lipid concentration from diets 1 to 5.
‡ Average analysed dietary lipid concentration from diets 6 to 10.
There were quadratic relationships between protein concentrations and weight gain in broiler chickens and the quadratic regressions in diets with different lipid content were significantly different (P<0·05) as shown in Table 2 and illustrated in Fig. 1. Similarly, different quadratic relationships (P<0·05) were observed between feed intake, FCR and protein concentrations in broiler chickens offered diets containing 46 and 85 g/kg dietary lipid. The maximum weight gain of 1809 g/kg was predicted when dietary protein equalled 342 g/kg in diets with low lipid concentrations, whereas the maximum weight gain of 1694 g/kg was predicted when dietary protein equalled 281 g/kg in diets with high lipid concentrations. The maximum feed intake of 2073 g/kg was predicted when dietary protein equalled 283 g/kg in diets with low lipid concentrations, whereas the maximum feed intake of 2624 g/kg was predicted when dietary protein equalled 272 g/kg in diets with high lipid concentrations. The influence of dietary protein on feed intake was more pronounced in diets containing high lipid concentrations. The predicted minimum FCR was 0·930 g/g when dietary protein equalled 375 g/kg in diets with low lipid concentrations, whereas the minimum FCR of 0·798 g/g was predicted when dietary protein equalled 363 g/kg in diets with high lipid concentrations. However, both predicted FCR were <1 g/g, which is not realistic.

Fig. 1 Quadratic relationships between analysed dietary protein (N) concentrations and growth performance in broiler chickens offered diets with low (![]() ) and high (
) and high (![]() ) lipid concentrations: (a) weight gain; (b) feed intake; (c) feed conversion ratio (FCR).
) lipid concentrations: (a) weight gain; (b) feed intake; (c) feed conversion ratio (FCR).
The effects of dietary treatments on nutrient utilisation in broiler chickens from 25 to 27 d post-hatch are shown in Table 3. AME was linearly correlated with dietary protein concentrations but regressions in diets with different lipid contents were not significantly different (P>0·05). Therefore, the linear regression between AME and dietary protein concentrations across all dietary treatments is included in Table 3 (r 0·911, P<0·0001). AMEn was also linearly correlated with dietary protein concentrations and regressions in diets with different lipid content were significantly different (P<0·03). In low-lipid diets, the linear regression between AMEn and dietary protein concentrations was y=0·0061x+12·672 (r 0·849, P<0·0001), whereas in high-lipid diets the linear regression between AMEn and dietary protein concentrations was y=0·0121x+11·454 (r 0·906, P<0·0001). There were quadratic relationships between AME intake and dietary protein concentrations (P<0·05), and the quadratic regressions in diets with different lipid contents were significantly different (P<0·03). The predicted maximum AME intake of 1·601 MJ/d corresponded to 349 g/kg dietary protein in diets with low lipid concentrations, whereas the maximum AME intake of 1·671 MJ/d was predicted when dietary protein equalled 266 g/kg in diets with high lipid concentrations. Quadratic relationships between AME:GE ratio (R 2=0·34, P<0·001), N retention (R 2=0·25, P=005) and dietary protein content were only significant in diets containing low lipid. The maximum AME:GE ratios of 0·875 MJ/MJ was predicted when dietary protein equalled 333 g/kg in diets with low lipid concentrations. The maximum N retention of 78·86 % was predicted when dietary protein equalled 254 g/kg in diets with low lipid concentrations.
Table 3 Effects of dietary treatments on nutrient utilisation in broiler chickens from 25 to 27 d post-hatch

AME, apparent metabolisable energy on DM basis; AMEn, N-corrected AME; AME intake, daily AME intake from 7 to 28 d post-hatch; AME:GE, ratio between AME and gross energy in the diets.
* Linear regression between protein concentrations and AME in all dietary treatment is shown because there were no significant differences between linear regressions in diets containing 40 and 75 g/kg lipid.
† Linear regression between protein concentrations and AME was only significant when all dietary treatments were considered.
The responses of apparent digestibility coefficients of protein (N), starch and lipid in the distal jejunum and distal ileum at 28 d post-hatch are shown in Table 4. Apparent protein digestibility coefficients were positively correlated with dietary protein concentrations in the jejunum and ileum but there were no significant differences between linear regressions of protein digestibility in diets with different lipid concentrations (P>0·25). Thus, the combined linear regression across all dietary treatments is shown in Table 4. The linear regression between apparent jejunal digestibility of protein (N) and dietary protein concentrations was y=3·51×10−5 x+0·6909 (r 0·583, P<0·0001), whereas the relationship between apparent ileal digestibility of protein (N) and dietary protein concentrations was y=2·98×10−4 x+0·7965 (r 0·819, P<0·0001).
Table 4 Effects of dietary treatments on apparent digestibility coefficients of protein (N), starch and lipid in the distal jejunum and distal ileum in broiler chickens at 28 d post-hatch

* Because of insufficient quantity, digesta samples from all cages within the same dietary treatment were pooled to determine apparent digestibility coefficients of lipid and starch.
Table 5 shows the response to dietary treatments on apparent disappearance rates of protein, starch and lipid in the distal jejunum and ileum. In the jejunum, protein disappearance rates linearly increased with dietary protein content in diets containing low lipid concentrations (r 0·980, P<0·0001), whereas there was a quadratic relationship between protein disappearance rates and dietary protein in high-lipid diets. The predicted maximum protein disappearance rate was 23·2 g/bird per d when dietary protein equalled 367 g/kg. Similarly, ileal protein disappearance rates increased with dietary protein content in low-lipid diets (r 0·984, P<0·0001) and the predicted maximum protein disappearance rate in high-lipid diets was 25·3 g/bird per d when dietary protein equalled 334 g/kg.
Table 5 Effects of dietary treatments on apparent disappearance rates (g/bird per d) of protein, starch and lipid in the distal jejunum and distal ileum in broiler chickens at 28 d post-hatch
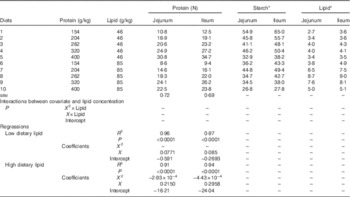
* Because of insufficient quantity, digesta samples from all cages within the same dietary treatment were pooled to determine apparent digestibility coefficients of lipid and starch. Average feed intake was used for calculation of starch and lipid disappearance rates.
The influence of dietary treatments on carcass weight and carcass composition in 28-d-old broiler chickens is shown in Table 6. Protein content in the carcass increased with dietary protein content in diets containing high lipid concentrations (r 0·933, P<0·0001), whereas there was a quadratic relationship between protein content in the carcass and dietary protein in diets with low lipid concentrations (R 2=0·93, P<0·0001). The predicted maximum carcass protein content in high- and low-protein diets was 71·0 % with 433 g/kg dietary protein. There were no differences (P>0·10) between linear relationships of carcass lipid, carcass gross energy and dietary protein concentrations. Across all dietary treatments, carcass lipid decreased with dietary protein (r 0·849, P<0·0001) and carcass gross energy also decreased with increasing dietary protein (r 0·849, P<0·0001). Carcass DM was only related to dietary protein in diets with low lipid concentrations (R 2=0·84, P<0·0001) and the predicted minimum DM was 37·0 % with 422 g/kg dietary protein.
Table 6 Effects of dietary treatments on carcass weight and carcass composition in broiler chickens at 28 d post-hatch
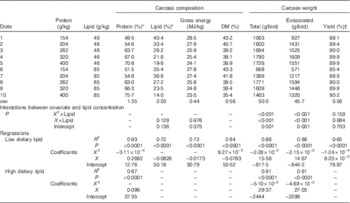
* Protein=N×6·25, DM basis.
† Yield=carcass without organs/whole carcass weight×100 %.
There are quadratic relationships between protein concentrations and total and eviscerated carcass weight in broiler chickens and the quadratic regressions in diets with different lipid content were significantly different (P≤0·001). The predicted maximum total carcass weight was 1844 g/bird when dietary protein equalled 342 g/kg in diets with low lipid concentrations, whereas the predicted maximum total carcass weight was 1784 g/bird when dietary protein equalled 288 g/kg in diets with high lipid concentrations. Similarly, the predicted maximum eviscerated carcass weight was 1658 g/bird when dietary protein equalled 341 g/kg in diets with low lipid concentrations, whereas the predicted maximum total carcass weight was 1602 g/bird when dietary protein equalled 288 g/kg in diets with high lipid concentrations. The quadratic relations between carcass yield and protein concentrations in diets containing different lipid concentrations were statistically similar (P>0·10); therefore, the quadratic relationship with all the treatments is shown in Table 6. The predicted maximum carcass yield was 90·5 % when dietary protein equalled 331 g/kg.
Discussion
Protein and lipid interaction
The potent impact of dietary protein on performance was modified by the dietary lipid level as there were interactions (P<0·001) between dietary protein and lipid concentrations for growth performance and nutrient utilisation. The predicted optimal protein concentrations for maximum weight gain was 17·5 % lower in broiler chickens offered diets with a higher lipid concentration. Broiler chickens were offered isoenergetic diets in the present study; therefore, protein and essential amino acids were more limiting in diets with high lipid concentrations. This is evident in Table 1, which shows that the calculated digestible amino acid and analysed protein concentrations in high-lipid diets were lower than those in their corresponding diets with low lipid concentrations. Thus, the differences in weight gain in broiler chickens offered high-lipid diets with different protein concentrations were more pronounced than in those offered low-lipid diets.
The predicted maximum weight gain of birds offered low-lipid diets equalled 342 g/kg dietary protein, whereas, the predicted maximum weight gain in birds offered high-lipid diets equalled 281 g/kg dietary protein. Both dietary protein contents exceed the practical range of dietary formulations generated using least-cost computer programs. However, the purpose of this experiment was to investigate the dose–response of protein and protein to energy ratios on performance and carcass traits; therefore, a broad range of dietary protein concentrations was examined. The genetic potential of modern broiler chickens was declared in high-protein diets as broiler chickens offered 400 g/kg protein diets exhibited an average FCR of 1·139 g/g, which represents a 23 % improvement v. 2014 Ross 308 Performance Objectives (FCR of 1·479 g/g from 7 to 28 d post-hatch). Moreover, the quadratic weight gain response to dietary protein concentrations may indicate a transition from protein-dependent to energy-dependent phases of growth performance. Consequently, the broad range of dietary protein concentrations examined in the present study still holds relevance for practical chicken-meat production.
N retention responded differently to protein concentrations in diets containing low and high lipid concentrations. There was a quadratic response to N retention in low-lipid diets and no significant correlations between N retention and dietary protein in high-lipid diets (Table 3). In pairwise comparison, broiler chickens offered diet 1 had higher N retention than did birds offered diet 6 (78·85 v. 70·15 %, P<0·05). By definition, both diets were protein deficient but the high-lipid diet 6 contained even lower protein and essential amino acid concentrations. In contrast, the reverse pattern was also observed. Broiler chickens offered diet 5 showed greater N retention than those offered diet 10 (70·03 v. 77·88 %, P<0·05). Broiler chickens offered diet 10 had 27·1 % lower feed intakes than birds offered diet 5 (1391 v. 1909 g/bird). Increasing feed intakes may depress N retention, as we have previously found a negative relationship (r 0·375; P<0·005) between these two parameters in a 7 to 28 d post-hatch broiler-feeding study (unpublished results). The average protein concentration in diets 5 and 10 was 338 or 18·9 g/kg digestible lysine. The cost associated with deamination of excess protein combined with the high energy in diet 10 may have depressed feed intake and reduced weight gain. The significantly higher feed intake in diet 5 suggests that starch may be a more compatible energy source than lipid in high-protein diets.
Although dietary protein or amino acid concentrations increased with decreasing lipid concentration, dietary lipid concentration did not influence apparent digestibility coefficients of protein (N) in the distal jejunum (0·782 v. 0·790, P=0·465) and ileum (0·879 v. 0·875, P=0·529). Martinez et al. ( Reference Martinez, Jimenez and Gonalons 11 ) reported that intraluminal infusion of lipids in poultry modulates gastrointestinal motility, delayed gastric emptying and increased transit time. Therefore, in the present study, it was expected that diets with a higher lipid concentration would generate higher protein digestibility but this was in contrast to observations from the present study. It is possible that dietary lipid levels of 46 or 85 g/kg were not sufficiently different in generating changes in the digestibility of protein (N). Further, the effect of lipids on protein (N) and amino acids may not be similar. For instance, Cowieson et al. ( Reference Cowieson, Bedford and Ravindran 12 ) reported that reducing dietary lipid concentration by 20 g/kg significantly reduced apparent digestibility coefficients of thirteen amino acids in 21-d-old broiler chickens, exceptions being methionine, tyrosine, phenylalanine and histidine. It is likely that different amino acids are limiting in diets with different crude protein concentrations and the overlay of the effect of lipid concentrations on amino acid digestion may have diminished the impact of lipid concentration on digestibilities of protein (N).
Protein v. non-protein
The influence of ileal digestible protein (N) and starch intakes and dietary lipid on weight gain is shown in Fig. 2. The contours are almost parallel to the y-axis, which suggests that protein intake more strongly influences weight gain than ‘non-protein’ intakes (starch and lipid), with weight gain increasing intake of digestible protein. Similar outcomes were observed in our previous study( Reference Liu, Selle and Raubenheimer 2 ), which showed that elevating protein intakes increased weight gain in broiler chickens from 10 to 23 d post-hatch and that starch and lipid intakes had little impact on weight gain. Accordingly, Berhe & Gous( Reference Berhe and Gous 13 ) reported that increased dietary protein concentrations (from 124 to 268 g/kg) significantly increased weight gain by 63 % and improved FCR by about 33 % in both male and female Ross broiler chickens from 0 to 21 d post-hatch. In the present study, feed intake was quadratically correlated to dietary protein concentrations (r 2 0·32, P=0·002), with diets containing extreme concentrations depressing feed intakes. Clark et al. ( Reference Clark, Gous and Morris 14 ) offered broiler chickens diets with protein concentrations ranging from 125 to 300 g/kg and also found a significant quadratic relationship between feed intake and protein concentrations (r 2=0·84, P=0·01), with diminishing responses to protein with increasing dietary protein levels. Liu et al. ( Reference Liu, Selle and Raubenheimer 2 ) suggested that current least-cost feed formulations are essentially designed to meet the amino acid composition of muscle, which partially overlooks the functionality of essential and non-essential amino acids. The ‘extra’ provision of certain functional amino acids with increased dietary protein levels may explain the performance responses observed to ostensibly excessive dietary protein levels.
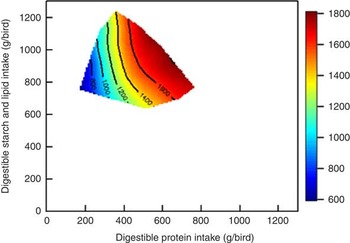
Fig. 2 Influence of intakes of starch, protein and lipid on weight gain in broiler chickens from 7 to 28 d post-hatch.
The influence of digestible protein (N), starch and lipid on carcass protein and lipid content at 28 d post-hatch is shown in Fig. 3. Carcass protein was increased, and carcass lipid decreased, by escalating digestible protein intakes. Jackson et al. ( Reference Jackson, Summers and Leeson 15 ) reported that higher dietary protein levels increased carcass protein concentrations from 40·7 to 50·7 % and decreased carcass lipid concentrations from 50·0 to 38·3 %. As considered by Swennen et al. ( Reference Swennen, Decuypere and Buyse 16 ), acute changes in dietary protein may cause rapid changes in de novo lipogenesis, and protein intake per se is an important regulator of de novo lipid metabolism in chickens. Indeed, Gous et al. ( Reference Gous, Emmans and Broadbent 17 ) offered broiler chickens the choice of selecting two diets with different protein concentrations and a protein balancer. Broiler chickens offered diets with high protein concentrations had lower abdominal fat content (17·8 v. 19·5 g/kg), and abdominal fat was increased by reducing dietary protein content or by diluting the diet with oil or starch.

Fig. 3 Comparison between intakes of protein and non-protein energy on protein (a) and lipid (b) in broiler carcass at 28 d post-hatch.
Protein and metabolisable energy
Protein and energy are considered in tandem in the formulation of practical diets for monogastric animals( Reference Campbell and Dunkin 18 ); therefore, the influence of protein to energy ratios on performance is relevant and either protein or non-protein energy could be limiting in diets. For example, Gous et al. ( Reference Gous, Wessels and Saunders 5 ) offered broiler breeder pullets diets with two levels of energy (9·46 and 12·47 MJ/kg) and three levels of protein (118, 140 and 161 g/kg); energy consumption in pullets offered low-protein diets were higher than those in birds offered high-protein diets (72·0 v. 60·0 J×10−6) and the major reason for the increased energy intake was the ‘overconsumption’ of lipids and starch by birds in order to reach their targeted protein intake. The quadratic relationships (P<0·0001) between dietary protein to AME ratios on carcass composition and weights in all ten dietary treatments are shown in Fig. 4. The maximum carcass protein concentration (75·3 %) and the minimum carcass lipid concentration (14·8 %) correspond to a protein:AME ratio ranging from 30·67 to 30·71 g/MJ as shown in Fig. 4(a) and (b). However, this prediction exceeded the highest protein:AME ratio tested in the present study (approximately 25 g/MJ) and high-protein diets generated higher mortality rates in chickens.

Fig. 4 Quadratic relationships between analysed protein (N) to AME (MJ/g) ratios on carcass weight and carcass compositions in all diets. AME, apparent metabolisable energy on DM basis.
There was a quadratic relationship (r 2 0·786, P<0·0001) between protein:AME ratios and carcass yield as shown in Fig. 4(c). The maximum carcass yield of 1623 g/bird corresponded to a protein:AME ratio of 19·61 g/MJ, which is higher than the recommended ratio of 16·58 g/MJ (215 g/kg protein and 12·97 MJ/kg) for grower diets. The sensitivity of growth performance responses to protein is also dependent on the non-protein components in the diet. In comparison with starch and lipids, protein is a more multi-functional macronutrient in animals. Liu & Selle( Reference Liu and Selle 19 ) compared the digestive dynamics of starch and protein and concluded that protein digestion and utilisation are more important to feed conversion efficiency than starch or energy in broiler chickens. Diets were isoenergetic in the present study and protein content in diets containing the higher lipid level were lower than those in the corresponding low-lipid diet. Therefore, it follows that birds responded robustly to protein when it is more limiting.
The ‘ideal’ or optimum ratio of protein:energy ranged from 19·61 to 30·71 as illustrated in Fig. 4. Both protein and energy should be considered in tandem but the ratio of protein:AME needs to be considered with caution because it depends on several factors including the absolute level of dietary nutrients, the age of the bird and its environment. Nevertheless, the selection of ‘ideal’ protein concentrations and energy densities, and their ratios, should not ignore the economical impacts of feed ingredient costs.
The impact of lipids
Diets containing the higher lipid concentration generated an 8·8 % reduction in feed intake (1823 v. 1999 g/bird; P<0·0001) in the present study, which is consistent with findings from the study by Liu et al. ( Reference Liu, Selle and Raubenheimer 2 ), in which lipids had a greater impact on feed intake than did starch and protein. Protein concentrations were diluted by the inclusion of additional lipids in the EE isoenergetic diets, and the protein:energy ratios reduced even further in protein-deficient diets. Therefore, it was not surprising that growth performance was depressed by the inclusion of additional lipids in the diet. Moreover, high-lipid diets also contained higher fibre concentrations as shown in Table 1. Therefore, it is possible that higher fibre concentrations in high-lipid diets also depressed feed intake in broiler chickens.
Another possible explanation for the reduction of feed intake is the lipid-induced triggering of the ‘ileal brake’. Martinez et al. ( Reference Martinez, Jimenez and Gonalons 11 ) reported that intraluminal infusion of lipids in poultry modulates gastrointestinal motility including an increase in duodenogastric refluxes or episodes of reverse peristalsis. These actions could delay gastric emptying and increase transit time, which is consistent with the ‘ileal brake’ mechanism similar to that described in mammals.
Digestive dynamics of protein and starch
Liu & Selle( Reference Liu and Selle 19 ) suggested that glucose and amino acids should be made available in appropriately balanced quantities at the sites of protein synthesis for efficient protein deposition and growth performance, and that protein digestive dynamics are more important to feed conversion efficiency and nutrient utilisation than those of starch. Fig. 5 shows the influence of the ratio of protein and starch disappearance rates in the distal ileum on growth performance, AME and carcass composition. The maximum weight gain of 1731 g/bird corresponded to a protein:starch disappearance rate ratio of 0·637 g/g (r 2 0·714, P<0·03). This is consistent with the findings from a study by Truong et al. ( Reference Truong, Liu and Selle 20 ), in which there was a significant linear regression between weight gain and protein:starch disappearance rate ratios in the proximal ileum. This suggested that increases in protein disappearance rates are advantageous to weight gain, whereas increases in starch disappearance rates are disadvantageous. Also, Liu & Selle( Reference Liu and Selle 19 ) suggested that protein is a more important determinant of growth performance and nutrient utilisation than starch. Further, AME (r 2 0·806, P<0·001) and carcass protein concentrations (r 2 0·912, P<0·0001) linearly increased with increasing protein:starch disappearance rate ratios. Alternatively, carcass lipid linearly decreased with increasing protein:starch disappearance rate ratios in the distal ileum (r 2 0·877, P<0·0001).

Fig. 5 Influence of the ratio of protein and starch disappearance rate on broiler chickens. AME, apparent metabolisable energy.
Nutritional geometry and rules of compromise
A nutritional geometry approach called the right-angled mixture triangle design (RMT) provides a novel means to relate feeding behaviour to responses in growth and nutrient utilisation in animal nutrition( Reference Liu, Selle and Raubenheimer 2 , Reference Liu, Truong and Khoddami 21 ). As illustrated in Fig. 6, the ten dietary treatments are mapped in an RMT with five nutritional rails( Reference Simpson and Raubenheimer 22 ). In nutritional geometry, the rules of compromise are defined as an animal’s response to non-complementary, nutritionally imbalanced food( Reference Simpson and Raubenheimer 23 ). In the present study, diets with different starch:protein ratios were used to investigate the rule of compromise as it applies to broiler chickens offered diets with unbalanced levels of starch (322–565 g/kg) and protein (115–325 g/kg). The intake array of treatment means is shown in Fig. 7. In low-lipid diets, the shape of the intake array is close to a straight line with a slope of 0·73 (y=−0·73x+1250). This is known as the ‘fixed proportion rule’( Reference Simpson and Raubenheimer 22 ), which means that the animal consumes feed up to the point on its respective nutritional rails where the shortage of starch is a fixed proportion of surplus consumed protein, in this case 0·73. In contrast, in high-lipid diets (Fig. 2(b)), the ‘closest distance’ rule of compromise was observed, in which an animal eats an amount that minimises the ‘as-the-crow-flies’ distance between the actual intake and target intake( Reference Raubenheimer and Simpson 24 ). The ‘closest distance’ rule of compromise in diets with a high lipid content was not observed previously by Liu et al. ( Reference Liu, Selle and Raubenheimer 2 ); this could be due to sub-standard feed intake and growth in broiler chickens offered fine, powdery, mash diets. In the present study, pelleted diets’ enhanced feed intake and growth performance was comparable with the 2014 Ross 308 performance objectives. Adequate feed intake allowed animals to express their natural behaviour and rules of compromise when nutritionally imbalanced food is provided.

Fig. 6 Plot of dietary compositions in ten experimental diets in a right-angled mixture triangle (each square dot represents one diet and the dashed line represents the nutritional rail); diets on the same nutritional rail contained similar dietary starch:protein ratios.

Fig. 7 Intake arrays in broiler chickens offered low (a) and high (b) lipid diets (●, average intakes of digestible starch and protein in broiler chickens offered each diet; - - -, nutritional rails; —, regressions between starch and protein intake).
Implications and conclusions
The outcomes of the present study are consistent with the previous findings reported by Liu et al. ( Reference Liu, Selle and Raubenheimer 2 ). The relative importance of macronutrients on performance was compared and it was found that protein had more pronounced impacts on growth performance and energy utilisation in broiler chickens offered high-lipid diets. This illustrates the need to consider both protein and energy, as well as their interaction, in the formulation of diets for broiler chickens. The balance of protein and energy was quadratically correlated with growth performance, carcass yield and compositions. The optimal ratio of protein to AME should be selected with caution given the additional feed ingredient costs of diets with high nutrient densities. In typical broiler diets, starch is the primary source of energy and the balance between protein and starch digestive dynamics is important for growth performance and nutrient utilisation.
Acknowledgements
The authors would like to thank Greg Hargreave from Baiada Poultry for his contribution to orientating this project from an industry perspective. The authors also acknowledge the technical assistance of Ms Joy Gill, Ms Melinda Hayter, Ms Kylie Warr, Mr Duwei Chen and Ms Katharine Dehon from Poultry Research Foundation for their assistance with bird management, sample collection and laboratory analyses.
The present study was funded by the Celestino Baiada Research Fellowship in Poultry Science, which is a generous donation to The University of Sydney from Baiada Poultry Pty Limited, Sydney, Australia.
The authors’ contributions are as follows: S. Y. L. contributed to the study design, data collection and statistical analyses; P. H. S., D. R., R. M. G., P. V. C., D. J. C., S. J. S. and A. J. C. contributed to the experimental design; S. Y. L., P. H. S., D. R., R. M. G., P. V. C., D. J. C., S. J. S. and A. J. C. contributed to the manuscript writing. All the authors read and approved the final version of the manuscript.
The authors declare that there are no conflicts of interest.


