
Abstract
Transparency in transport processes is becoming increasingly important for transport companies to improve internal processes and to be able to compete for customers. One important element to increase transparency is reliable, up-to-date and accurate arrival time prediction, commonly referred to as estimated time of arrival (ETA). ETAs are not easy to determine, especially for intermodal freight transports, in which freight is transported in an intermodal container, using multiple modes of transportation. This computational study describes the structure of an ETA prediction model for intermodal freight transport networks (IFTN), in which schedule-based and non-schedule-based transports are combined, based on machine learning (ML). For each leg of the intermodal freight transport, an individual ML prediction model is developed and trained using the corresponding historical transport data and external data. The research presented in this study shows that the ML approach produces reliable ETA predictions for intermodal freight transport. These predictions comprise processing times at logistics nodes such as inland terminals and transport times on road and rail. Consequently, the outcome of this research allows decision makers to proactively communicate disruption effects to actors along the intermodal transportation chain. These actors can then initiate measures to counteract potential critical delays at subsequent stages of transport. This approach leads to increased process efficiency for all actors in the realization of complex transport operations and thus has a positive effect on the resilience and profitability of IFTNs.
1 Introduction
Driven by supply chains with a more and more global reach, today’s freight transport networks must connect increasingly distant production and sales regions, and such global competition leads to increasing demands for service, delivery times and cost efficiency. Simultaneously, constraints such as limited space in facilities and regulations (e.g., environmental protection and customs) must be considered. These factors create greater dynamics and complexity in global freight transport networks, resulting in increased vulnerability.
This increased vulnerability becomes apparent in supply chains when companies simultaneously try to to reduce risk buffers as a result of rising cost pressure. Interviews revealed that instead of short but unstable transport times, companies prefer somewhat slower transports with a reliable arrival time, as this allows them to establish stable processes along the supply chain. This requires more transparency along all of the production and transport processes. In this context, the transport processes are of particular importance, as they do not take place in a protected environment such as a factory building, but on a shared infrastructure where they are exposed to environmental influences.
To increase their supply-chain visibility, actors in the supply chain use transport management systems as well as track-and-trace systems. However, these systems currently only provide information on how the transport of a loading unit is planned and where it is located at that moment, but not how its further transport is likely to be realized. This would especially be important in regard to disruptions, which propagate through the network. A small delay in the first leg of the transport chain can have negative cascading effects at all subsequent legs and eventually lead to missing a scheduled connection that cannot wait. An important metric that builds upon transparency is the estimated time of arrival (ETA) of transports.
ETAs are especially interesting for intermodal transports, in which schedule-based and non-schedule-based transports are usually combined. The term “intermodal transport” refers to a transport chain in which loading units such as intermodal containers are transported by at least two different modes of transport, including transshipment. Generally, trains or ships that follow strict schedules cover the majority of the distance. The more flexible road transport of the loading unit is used only over short distances for pre- and post-carriage, for example, to transport goods to a rail or sea terminal or to collect goods again at the unloading point.
In supply chains using intermodal freight transport networks (IFTN), accurate and up-to-date ETAs can be used for each transshipment point to determine whether a connecting transport will be reached or not. If included into an information-sharing platform, this would allow proactive communication and thereby enable different actors to consider and take appropriate measures to potentially compensate for existing delays. Thus, the resilience of IFTNs as well as of supply chains can be improved by determining ETAs. This in turn would enable the various actors to make the supply chain more efficient and cost-effective.
To derive accurate ETAs, a large quantity of data with a high variety and velocity must be collected and processed. This is especially demanding for complex IFTNs because different actors cover the different legs of the intermodal transport chain. The different goals and IT structures substantially increase the effort required for data collection, cleaning and connection. However, the major difficulties when calculating ETAs in IFTN arise from the different characteristics of the various modes of transport: the intermodal transport chain connects scheduled and unscheduled transports, which creates peaks in the distribution of possible arrival times and prevents the determination of an ETA prediction with a fixed confidence interval for the entire transport chain. In addition, the loading capacity of some means of transport, such as ships and trains, and the transshipment capacity at transshipment points are limited, which creates further restrictions for ETA prediction.
These factors lead to the overarching question addressed in this computational study: What is an appropriate structure for ETA prediction of containers in intermodal transport chains?
To answer this question, we look at an example IFTN that connects the German hinterland with the port of Hamburg. The IFTN was analyzed in regard to physical and IT processes by means of 25 semi-structured interviews with various actors within the network. These interviews were used to identify the requirements for ETA prediction, available data, possible transport disruptions and expected challenges in the implementation of integrated ETA prediction for whole intermodal transport chains. This process was followed by the acquisition and transformation of extensive amounts of historical data for 2015–2017. The data include process data from railway operators, railway transport companies and inland terminal operators, network data from railway infrastructure companies and additional data from weather services.
Usually, when large amounts of data are available, one potential approach is to derive a descriptive microsimulation model that maps the structure of the underlying system in detail. However, the extent of the dynamics and complexities within IFTNs is too large for such a model to be feasible. Nevertheless, the recently emerging field of machine learning (ML) opens up new possibilities.
A purely data-driven approach using ML would not be effective for ETA predictions in IFTNs because intermodal transport chains usually include buffer times between the rigid timetables of some modes of transport and often include added services, such as storage. The pure application of ML to the overall intermodal transport chain would lead to a predictive model that ignores the logistics structure of the chain and therefore mixes transport times, buffer times and storage times. The ETA prediction produced in this manner would not be very meaningful, as it would not be possible to distinguish between planned and unplanned storage times. Moreover, a container can be shipped via different routes for the same origin–destination pair. Ignoring this feature would result in greatly varying predictions. Knowledge of the actual transport processes is necessary to develop an appropriate ETA prediction model using ML for an intermodal transport chain. This knowledge enables the identification and inclusion of logistics structures in the overall approach.
Such a mixed approach of ML methods and the mapping of logistic structures for ETA prediction in IFTNs does not exist in current research. In recent years, freight transport research on ETA predictions has focused on single modes of transport, especially on road transport executed via trucks. As a result, much of the data generated by today’s IFTNs remains unused. Being able to leverage these data through the new possibilities introduced by ML holds great potential in terms of transparency and operational efficiency.
Therefore, the aim of this computational study is to develop an approach to ETA prediction that uses existing data from different actors to cover the entire intermodal transport chain.
To reduce the complexity and to make specific and accurate predictions for each actor, the overall ETA prediction was divided into subproblems covering the individual legs of the intermodal transport chain, and an appropriate ML method was identified for each leg. Then, each submodel was developed in four steps: (1) system structuring (2) feature engineering and feature selection, (3) model selection and model tuning, and (4) system validation. As the data allow for the identification of single containers and for assignment to trucks and wagons on a train, all predictions can be transferred to subsequent legs of the transport chain, thus acting as inputs for the following predictions. Therefore, all the individual predictions can be combined into an overall ETA prediction that covers the entire intermodal transport chain from the origin to the final destination.
The rest of this paper is organized as follows. The terminology and structures of IFTNs are clarified in Sect. 2 to provide background information about the underlying system. Section 3 reviews some of the literature on ETA predictions for different modes of transport, intermodal transport and ML techniques. The problem as well as the methodology and data used to solve it are formally described in Sect. 4. Section 5 applies this method to an inland terminal and the following train connection. Section 6 draws conclusions and discusses some important considerations for applying the method.
2 Research Background
IFTNs usually consist of several distinct transport legs using multiple means of transportation that can include transport via truck (road), train (rail), plane (air) or ship (river, sea). The different natures of these modes of transport necessitate the existence of processing facilities within the IFTN. During a shift from road to rail transport, for example, the containers have to be transferred from trucks to trains. These transfers are executed in terminals that employ cranes to transfer containers. Employees of these terminals also manually check and assure compliance with safety regulations. Additionally, the overall load of a train must also sometimes be broken down, separated and allocated to new trains. Consequently, the IFTN consists of transportation between nodes that can be conducted by either trains or trucks and of transfer and reallocation processes at the terminal nodes. In addition to terminal nodes, the IFTN includes starting nodes and destination nodes.
Since some modes of transport operate according to strict schedules, the question arises of whether a container can reach its planned connection on time. The most important of these transitions are the flexible container delivery by truck in the hinterland terminal with onward transport by scheduled train, the formation of a scheduled train in the marshaling yard for onward transfer to the port of Hamburg and the marshaling of the wagons from the port’s entry station to the sea terminal for loading onto the scheduled ship.
As the shippers of the containers at the starting node are companies that rarely have a direct connection to railways, the first leg of the overall transport is usually a truck. Depending on the ultimate destination of the container, the same applies for the last leg. In the case of continental transport, the combination of truck, rail and truck is often standard. For intercontinental transport, which is the focus of this paper, ship transport is the main leg. Since hinterland transport is organized very differently in various export and import nations, the scope of this paper is further limited to sea freight containers in the first leg, i.e., transport from the shipper to the exporting ship.
As a basis for research, an initial system analysis was conducted in the context of the SMECS project (Smart Event Forecast for Seaports) funded by the German Federal Ministry of Transport and Digital Infrastructure. One major goal of this system analysis was the identification and mapping of relevant physical and information processes in the IFTN. To gain insight into the different processes, a total of 25 semi-structured interviews were conducted with various actors within the network.
Based on the insights from the interviews, two main relations were identified for developing the heuristic solution. Two inland terminals, one in the south and one in the east of Germany, as well as the port of Hamburg in the north, were chosen (Fig. 1). These two terminals are an essential part of important transport routes connecting the Eastern respectively Southern European hinterland with the major ports in Northern Germany, Belgium and the Netherlands. The selected terminals are representative also for other typical inland terminals as they provide the usual container storage areas, several railway tracks and gantry cranes. Further we selected terminals of different size, the southern terminal being approximately 50% larger than the eastern terminal.

Chosen logistics nodes and corresponding transport relations within Germany
Data were gathered at the container level for these three logistics nodes and the train connections between the inland terminals and the port, including the preceding road transport. As trains transport containers to various sea terminals and marshaling capacity in the ports is very limited, trains from different origins are often sorted into sea terminals in an extra marshaling yard before they reach the port. This marshaling yard is also part of the study (Fig. 2).

Intermodal container transport chain from the shipper to sea transport
3 Literature Review
A distinction can be made in the scientific literature between two types of approaches to ETA and delay prediction: approaches that map the structure of the underlying system and data-based approaches. Structure-based approaches can be further categorized into simulation models and analytical models. Simulation models are based on existing simulation software, such as OpenTrack (Nash and Huerlimann 2004) and Railsys (Radtke and Hauptmann 2004), or are developed individually. Analytical models can be further divided into two subcategories, depending on whether they are based on graph theory or queuing theory. Examples of delay prediction based on graph theory include timed event graphs (Goverde 2010), activity graphs (Büker and Seybold 2012), and Petri nets (Zegordi and Davarzani 2012). Queuing theory models can be designed as Markov chains, as shown by Özekici and Sengör (1994). Structure-based approaches can lead to very precise results but are not feasible for real-time application in IFTNs because the networks are too complex for detailed modeling. Even if such models could be developed, they would require considerable processing power. However, processing times are critical to real-time operations to communicate updated ETAs at short notice. Therefore, data-based approaches are better suited for such applications, as they allow for approximately real-time evaluation of disruptions and their consequences.
Data-based approaches mostly use conventional statistical methods, such as multiple linear regression, logistic regression, time series analysis and Bayesian networks (Zhang et al. 2016). However, these basic methods lead to poor results in complex systems because they can only account for a very small number of explanatory variables and thus oversimplify complex relationships. To date, more modern methods, such as ML, have been only selectively considered in transport research. In general, various approaches to delay prediction are found in the field of ML: artificial neuronal networks (Yaghini et al. 2013), support vector machines (Markovic et al. 2015), decision trees (Van Riessen et al. 2016), and k-nearest neighbor algorithms (Chang et al. 2010), among others. Although these methods can be applied for real-time analysis, data-based approaches represent the minority of the scientific literature in transport science compared to model-based approaches.
In terms of ETA predictions in general, research exists for all modes of transport. For road traffic, many ETA prediction solutions have been implemented in practice, for example, in navigation systems. However, these solutions are often unable to satisfy operational requirements or take dynamic events, such as weather, into account. In addition, the existing solutions generally do not include ETA-based measures for real-time operations management.
Regarding rail transport, the focus of the scientific literature and practical solutions is on passenger transport, while rail freight transport is rarely considered. The research on rail freight transport predominantly uses model-based approaches and focuses on the prediction of follow-up delays, not initial events. Examples include Schön and König (2018), with their stochastic dynamic programming approach for delay management of a single train line, and Yuan (2006), who evaluates the statistical fit of seven different probability distributions to empirical data on arrival and departure delays of 14 trains at a train station in The Hague, Netherlands. In contrast, Barbour et al. (2018) use a data-driven approach to predict ETAs of individual freight trains based on the properties of the train, the network and potentially conflicting traffic in the network. They formulate the ETA prediction as a ML regression problem and solve it using support vector regression, trained and cross-validated on over two years of detailed historical data for a 140 mile section of track located primarily in Tennessee, USA. In practice, ETAs for rail freight transport in Germany are currently performed by forward projection of already existing delays.
Solutions that include several means of transport for door-to-door transport as a whole are not available. Research on intermodal subsections, and thus on logistical nodes such as inland terminals, marshaling yards and ports, is also rare. One example of such research is the queuing model for intermodal container terminals and the following rail transport introduced by Leachman and Jula (2012). This model is used to estimate the dwell and transit times of containers as a function of changes in infrastructure, staffing levels at terminals and import volumes, which in essence represents an ETA prediction.
In addition, there are several scheduling approaches for IFTN: van Riessen et al. (2016) use decision trees to create reliable schedules, Boysen et al. (2013) formalize and develop heuristics for truck scheduling problems in cross-docking terminals, Wang and Yun (2013) use tabu search on small-scale networks, Li et al. (2015) deduce and solve linear programming problems for large-scale networks, and Schönemann (2016) determine the reliability of planned dwell times based on Monte Carlo generated data. Another interesting approach to address rescheduling in hinterland traffic using a mixed-integer programming model is provided by Qu et al. (2019). These studies provide an important basis for ETA predictions, as planned times are as important as historical data on the timestamps of actual process steps. However, these methods cannot be used to predict ETAs.
A similar field that has made scientific achievements relevant to this work, is concerned with the scheduling of jobs and the management of capacities. Current overviews of the research area are presented by Van den Bergh et al. (2013) and Defraeye and Van Nieuwenhuyse (2016), among others. Both works refer to scheduling of personnel and show that inaccurate forecasts and assumptions lead to inadequate scheduling. However, the analyzed models are not limited to personnel planning, but are rather relevant for a wide range of problems including transport operations. Directly referring to job scheduling and capacity management in intermodal networks are Gao et al. (2020), providing analytical tools and insights on how to manage network capacity. They state that intermodal network operations often suffer from chronic asset imbalance over time and across locations, because of environmental uncertainty and network interdependence. One of the most critical factors for imbalance that they identify is heterogeneous lead time. An integrated approach to personnel scheduling and job scheduling under uncertainty combined with an ETA prediction like the one presented in this paper would represent a significant improvement in the capacity planning process.
The connection problem plays a major role not only in IFTNs but also within other means of transport that are oriented towards passengers. Examples of such work can be found in Diana (2014) for connecting flights and Zhao et al. (2013) for tram rides with changing trains.
Initial attempts to develop integrated ETA prediction in relation to large intermodal transport networks can be found in the ELETA project (“Electronic Exchange of ETA information”) (ELETA 2017). The project considered 12 selected intermodal transport relations run by operators from five European nations. Its objective is to demonstrate the practical value of streamlining exchange of ETA information and to overcome legal, operational and technical obstacles in this exchange. However, the focus of ELETA is on establishing an electronic data exchange link between all actors and feeding valid ETA information into it: improvement of ETA predictions itself is not the core of the project.
4 Methodology
4.1 Research Approach
To address the research question of what the structure of an ETA prediction for containers in intermodal transport chains should be, we applied the research methods outlined in Fig. 3.

Overview of applied research methods
The system and demand analysis, along with the associated steps, were performed to gain a deeper understanding of the intermodal transport chain and to identify the benefits and requirements of ETA prediction. This approach comprises a comprehensive analysis of operational processes, IT processes and disruptions by means of literature research and strong involvement of market representatives. Partner companies were involved in various ways: they contributed important technical information, enabled the inspection various facilities, and provided the necessary operational data.
To reduce the problem complexity and address the diverse objectives and disruptions within the transport network, the overall ETA prediction problem was split into several independent but interacting subproblems. These problems were then solved successively, with the prediction of the first partial model acting as input to the second partial model and so forth (Fig. 4).

Segments of intermodal transport and corresponding partial prediction models
Different results are generated for each transport leg. By being able to assign an intermodal container to a truck or wagon and train, all predictions can be transferred to other reference objects. Travel and arrival times are determined for transport by both truck and train. In the logistics nodes, that is, the inland terminal and marshaling yard, the lead times of containers and departure delays of trains are predicted. Based on this information, whether a train can be reached is predicted. A similar approach is taken for ports. Finally, the individual predictions are intelligently combined into an overall ETA prediction to determine whether the intermodal container can reach the planned ship, regardless of the transport leg in which the sea freight container currently is.
4.2 Data Selection
The system analysis was accompanied by the acquisition and transformation of extensive amounts of historical data for the years 2015–2017. The data include process data from railway operators (DB Netz AG), railway transport companies (DB Cargo AG) and inland terminal operators (Deutsche Umschlaggesellschaft Straße-Schiene mbH), network data from railway infrastructure companies (DB Netz AG) and additional data from weather services (Deutscher Wetterdienst). The data include more than 1 million container movements, 35,000 train runs, 96,000 truck trips, and 33 million weather values (Fig. 5).

Structure of the collected data
Given the qualitative analysis of the system, the two focal relations, the corresponding data, and the requirements of the different actors, the ETA prediction model itself is developed.
4.3 Machine Learning
Artificial intelligence in the form of ML was employed to produce algorithms to draw insights from historical data sets without having to determine the individual relationships of the underlying system. Since data on actual transport times, processing times and connections reached are available, supervised learning can be used, which makes it possible to forecast future transports accurately on the basis of already realized transports. Thus, ETA prediction can be performed without modeling every detail of the complex intermodal transport network.
All models are implemented in R and follow the same four development steps: (1) system structuring, (2) feature engineering and feature selection, (3) model selection and model tuning, and (4) system validation. Moreover, the segments of the IFTN differ considerably in terms of operational restrictions and data aspects. Therefore, all development steps must be performed separately for each transport segment; thus, different technical approaches are followed for each partial prediction model.
The prediction model that estimates the transport time on road between the shipper and the inland terminal uses linear regression trees. The lead-time regression in the inland terminal is based on random forests, with which the connecting train is then determined. Random forest and gradient boosting are used to predict the transport time for all rail sections between the individual operating points along the transport route from the inland terminal to the sea terminal. To predict the connecting train in the marshaling yard ordinal forests are used.
All prediction models are trained on 70% of the available data. The remaining 30% of the data is used to test the prediction quality. Validation is performed via tenfold cross-validation, and the caret package is used for parameter tuning. Training and validation of the individual models is performed separately. The combination of the individual predictions to an overall ETA prediction is based on the trained individual models and raw data in a web-based tool, which was implemented using R shiny and Java Script.
4.4 Challenges of Modeling Connections
The following paragraphs explain the difficulties of combining the partial models for tracking a specific container through the IFTN. The predictions of a partial model for one transport leg often include a confidence interval that indicates a range of potential arrival times rather than one distinct value. The result of this prediction could be plotted as a probability distribution function (pdf) such as that shown in Fig. 6, where the probability peaks at one point.

Example of a simple pdf for transport arrival times
This simplistic approach, however, cannot be applied to IFTNs for several reasons. The amount of data and the interconnectedness of the data are in the realm of big data, where empirical approaches might no longer be the best solution. Moreover, the structural properties of IFTNs pose problems to empirical analysis, as they introduce breaks and thus nonlinearity into overall transport times. This problem arises mainly due to the interaction between scheduled and unscheduled means of transport.
A truck, for example, can usually arrive and depart to and from a company’s or terminal’s loading area at any given time. A train or ship, on the other hand, is restricted by schedules due to the limited capacity of the rail network or berths. Hence, trains and ships are generally bound to their planned arrival and departure times, which can also deviate, but not to the same extent as for trucks. As a result, delay of transport during the first leg to the first processing node can cause a container to miss its connecting train on the second leg. A train, unlike a truck, carries a load of many containers and cannot always wait for one or several late arrivals. Additionally, terminals have processing schedules and do not always allow for late departures.
Having missed its planned train, the operator of the terminal will attempt to add the container to a later train. This could be the next train with the same destination, but this train could already be fully booked, which would lead to an even later departure. This delay has important implications for the prediction of ETAs in IFTNs. In general, the overall transport can be divided into two categories.
-
1.
Transports that do not miss any connecting trains If delays during all transport processes of the overall transport stay within manageable ranges, making it possible for the container to reach all its connecting rail transports, the ultimate arrival time at the destination will be within a certain interval around the planned arrival time. The distribution of potential arrival times for this case is indicated by the depiction of the uppermost pdf in Fig. 7. Notably, the arrival could also be prior to the planned arrival time in some cases.
Fig. 7 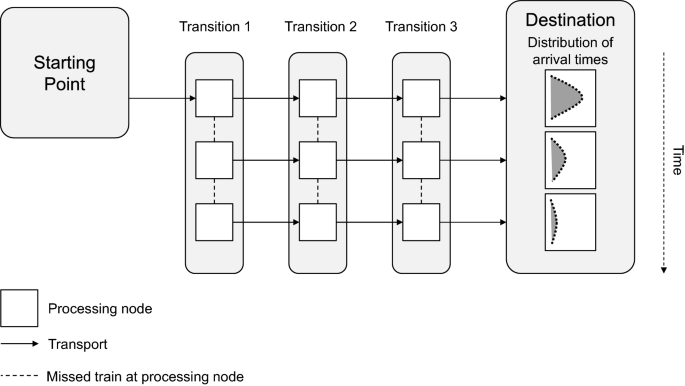
Overview of overall transport segments and resulting arrival time pattern
-
2.
Transports that miss at least one connecting train If one or more transport processes of the overall transport lead to a connecting rail transport being missed by the container, the container will experience a notable increase in predicted arrival time at the destination. This delay results from the fact that train schedules are given and all future uncertainties related to the ultimate arrival time will evolve around the new planned arrival time that is based on the new connecting rail transport. The distribution of arrival times related to the case where exactly one connecting train is missed is given by the middle pdf in Fig. 7. Correspondingly, the case of two missed connecting trains is given by the lowermost pdf. The description can be extended accordingly depending on how many connecting trains are part of the overall transport in question.

Taking into account the fact that trains are, to a certain extent, bound to schedules leads to the insight that the overall ETA of a container at the destination follows a distribution with multiple peaks, as in Fig. 7, if connecting trains are missed.
It remains to be defined whether this is the case in the specific IFTN in question. Specifically, the shape of the distribution of the ETA of a container for all cases in (2) depends on the assumption regarding the handling of delays that would normally lead to a missed connecting train. There are three general options:
-
(a)
The connecting train waits for the delayed container: This assumption leads to a simplification to case (1). As a result, all expected deviations along the overall transport are simply added together to form the distribution of arrival time at the destination, the ETA.
Assume an overall transport that consists of three distinct transport legs and four nodes: a starting point, two processing nodes and a destination (Fig. 8). The probability distribution that results from the estimation of transports is denoted as \(E\left( {t_{i} } \right)\) for any transport leg \(i \in \left\{ {1,2,3} \right\}\). Similarly, the processing time at node \(j \in \left\{ {1,2} \right\}\) is denoted as \(E\left( {p_{j} } \right)\).

Generation of ETA predictions for the direct-connection case
We can model the ETA for this waiting-connection case, given by \({\text{ETA}}_{\text{W}}\), simply as the convolution of the pdfs of all travel time distributions of transports and the pdfs of the processing times at the nodes:
where \(ETA_{W}\): distribution of arrival times at the destination when the train waits for the focal container. \(E\left( {t_{i} } \right)\): probability distribution resulting from the estimate of the transport time on leg i. \(E\left( {p_{j} } \right)\): probability distribution resulting from the estimate of the processing time at transition node j.
-
(b)
The connecting train does not wait, but the container gets a guaranteed spot on the next train with the same destination: This assumption can lead to either one or several breaks in the overall transport, depending on how many different transport legs exhibit a critical delay. As a result, the general probability mass for this segment at the destination of the overall transport will decrease the further it is projected into the future. An example of this case is displayed in Fig. 7, where the curves (probability mass distributions) decrease for future arrival periods.
This scenario introduces the necessity of knowing the schedule in the prediction but still restricts the number of general possible outcomes, in our setting, to three. The notation of transports is extended to account for the different connecting trains that the container can be transported on for each transport leg. Thus, \(E\left( {t_{i}^{c = k} } \right)\) represents the probability distribution of transport leg \({\text{i}}\), given that the container is part of scheduled train number \({\text{k}}\) on this portion of the overall transport.
The prediction model has to account for the different likelihoods of the container being on all potential trains. At each transfer point (node), there can only be two options in the first-in first-out (FIFO) connection case – the connecting train is either reached or not reached. It follows that there are only two probabilities to account for at each transfer, which we define as:
and
where \(\upomega_{\text{i}}^{0} +\upomega_{\text{i}}^{1} = 1\). Equation (2) states the likelihood that the container will reach its connecting train, given the container is currently on scheduled train number \({\text{k}}\). Accordingly, (3) states the likelihood that the container will miss its connecting train given train number \({\text{k}}\). Notably, the estimates for the processing times in the nodes are assumed to be independent of the train number \({\text{k}}\). An overview of the FIFO connection case is given in Fig. 9. The general prediction model of the case is considerably more complex than that for the direct-connection case in (a). The overall prediction for the ETA can be described as follows:
where \(ETA_{FIFO}\): distribution of arrival times at the destination when the container takes the next free train. \(E\left( {t_{i} } \right)\): probability distribution resulting from the estimate of transport time on leg i. \(E\left( {p_{j} } \right)\): probability distribution resulting from the estimate of processing time at transition node j. \(E\left( {t_{i}^{c = k} } \right)\): probability distribution of transport leg I, given that the container is part of scheduled train number k. \(c\): indicates which connection the train is “catching”, with c = 1 being the originally planned connection. \(\omega_{i}^{0}\): probability that the connecting train x will be reached on transport leg i. \(\omega_{i}^{x}\): probability that a connecting train x will be reached on transport leg i.

Generation of ETA predictions for the first-in first-out connection case
-
(c)
The connecting train does not wait, and the container gets a spot on the next train that has free capacity. The difference from the previous assumption is that the extent of the break resulting from a critical delay during a transport leg is no longer restricted. If the next train is already fully booked, the container will face an even greater overall delay: the subsequent train may also already be fully booked. Therefore, a more general form of the overall ETA distribution at the destination must be considered. Depending on the schedule and utilization of trains, it may be more likely that a train arrives at its destination two periods later than its planned arrival than one period after its planned arrival.
Since an illustration of all steps for all partial models would go beyond the scope of this paper, the next section on numerical results is limited to the prediction of lead times for one of the inland terminals and for reaching of the respective connecting train.
5 Findings
5.1 Numerical Results
The considered inland terminal in the east of Germany has two terminal modules, each with four 700 m tracks and two gantry cranes. The storage capacity is approximately 600 TEU (twenty-foot equivalent unit, based on the volume of a 20-foot-long intermodal container) on the ground, which can be increased to 1800–2400 TEU by stacking. Approximately 220,000 cargo units are turned over each year. Figure 10 shows the distribution of the actual lead times for 2015–2017.

Distribution of the actual processing times for the years 2015–2017
The availability of the actual arrival and departure times of the containers from which the processing times shown in Fig. 10 were calculated makes supervised learning possible. In addition to the historical actual processing times, the following data were acquired for predicting future lead times.
Most of these data can be used directly as a feature for prediction. This includes all data in numerical and factorized form. ML algorithms cannot handle other data types, such as the date time-format POSIXCT and character. The booking number and the container number are used to connect the inland-terminal data to other data, such as the train operator’s planning data. The train numbers are used to connect the inland-terminal data to the train schedule data and actual train run data of the infrastructure operator. The actual processing time, which serves as the target value of the ML algorithm, is calculated based on the actual departure and arrival. The actual arrival time is important for processing-time prediction: since it cannot be processed in its present form, feature engineering begins here.
Feature engineering, the process of using domain knowledge to create features that enable an ML algorithm to function, is important in the development of prediction models, as better features can produce simpler and more flexible models and often lead to better results. From the container arrival time at the inland terminal, we extract the month, weekday and hour as features. Additional more complex features are also considered, for example, the container arrival frequency and the number of containers in the inland terminal. Ten additional features were engineered for the processing time prediction of the inland terminals.
Together with the ten observations in Table 1, which can be used directly as features, there are a total of twenty features for prediction. Due to the complexity of the problem, which features have the greatest impact is difficult to determine. Some features might be redundant; some, just irrelevant. An excessive number of features can even worsen the prediction, as they can generate unnecessary noise or lead to overfitting. The use of more features also increases the complexity of the problem and, therefore, the computational workload. Thus, selection of the best features is an essential part of model development (Table 2).
Feature selection enables faster training, reduces model complexity, facilitates interpretation, reduces overfitting and improves model accuracy if the correct subset is selected. One of the best ways to select features is to use wrapper methods to evaluate subsets of features by deriving a prediction model from each subset and comparing the performance. Performance is measured in terms of the root mean square error (RMSE), the standard deviation of the distance between the real and the predicted data points. The higher the RMSE is, the worse the prediction. Wrapper methods provide the ability to identify possible interactions between features, and recursive feature elimination is used within the wrapper method. The process begins with the full set of features and then iteratively removes the least useful predictor, one at a time. The results of the feature selection for the processing time prediction are shown in Fig. 11.

Root mean square errors of the feature subsets in the feature selection process
Under the restriction of finding the best set of 10–19 features, the wrapper method selects twelve features. The ranking of feature importance is shown in Fig. 12. It becomes clear that train properties and terminal properties such as capacity utilization and departure frequencies are much more important than environmental influences such as wind speed and container properties such as their weight or dangerous goods status.

Ranking of the feature importance
The random forest model with an RMSE of 14 h provides the best predictions: 52% of the predictions are within the 10% corridor in Fig. 13 and differ by less than 10% from the values actually observed.

Comparison of the observed and predicted processing times in the inland terminal
However, the lead time is not crucial for overall ETA prediction. More important is which train is expected to be reached. The departure times and travel times are then predicted for this train. To determine which train is reached, the predicted lead time is added to the actual arrival time of the container, and the next train running according to the schedule is selected. The comparison between the predicted train and the train with which the container was actually transported is shown in Table 3.
5.2 Discussion
Figure 13 shows that the processing times of containers handled by the terminal are well predicted when the processing time is longer than 24 h. In the case of shorter processing times, there are still deviations. The prediction algorithm overestimates these values due to the lack of separation between the storage time and loading time of the containers. One observation that would help with this separation is the moment of loading: these data exist but have not been made available. Integrating the moment of loading into the prediction algorithm should greatly improve the prediction quality.
The prediction for the inland terminal is much better if one considers that the decisive factor is not the processing time but which train is reached. Since trains depart from the terminal only every 1–2 days, the classification of which train is reached is 95% more accurate than the regression of lead time. Thus, it is much more difficult to predict the processing times of logistics nodes than those of pure transports.
6 Conclusion
This computational study of ML techniques shows models for ETA prediction of sea freight containers in intermodal transport chains. It presents the proof-of-concept of ETA predictions in complex IFTNs using ML methods. The possibilities and limitations of a practice-oriented implementation of ML to improve reliability in transport networks are illustrated.
The results show how important the consideration of logistic nodes is for ETA prediction in intermodal transport and emphasize the importance of information about the logistics process, even if it is not ultimately modeled in every detail. Moreover, the results also show how important data availability and data quality are. If companies want to make better use of their existing capacities in the future by using ML algorithms, they will first need to work on data availability and quality.
The developed models enable actors in the intermodal transport chains to evaluate the immediate impact of delays on downstream processes. The ETA information is primarily seen as an instrument for early support for operational decision-making problems, e.g., disposition of personnel, vehicles, tools, and infrastructure.
If made available on modern information-sharing platforms, supply chain actors could use ETA information to improve capacity management, reduce risk buffers and increase resource utilization. An automation of decisions by rule-based application of certain measures depending on ETA predictions is feasible. In addition, early communication of delays can contribute to increased customer satisfaction.
References
Barbour W, Mori JCM, Kuppa S, Work DB (2018) Prediction of arrival times of freight traffic on US railroads using support vector regression. Transp Res Part C Emerg Technol 93:211–227
Boysen N, Briskorn D, Tschöke M (2013) Truck scheduling in cross-docking terminals with fixed outbound departures. OR Spectr 35:479–504
Büker T, Seybold B (2012) Stochastic modelling of delay propagation in large networks. J Rail Transp Plan Manag 2(1–2):34–50
Chang H, Park D, Lee S, Lee H, Baek S (2010) Dynamic multi-interval bus travel time prediction using bus transit data. Transportmetrica 6(1):19–38
Defraeye M, Van Nieuwenhuyse I (2016) Staffing and scheduling under nonstationary demand for service: a literature review. Omega 58:4–25
Diana T (2014) Measuring change in the levels of scheduled arrival reliability: an application of ordinal logistic regression. J Airpt Manag 8(3):214–225
ELETA (2017) Electronic exchange of ETA information. http://www.uirr.com/en/projects/ongoing/item/21-electronic-exchange-of-eta-information/34-ongoing.html. Accessed 9 Jan 2020
Gao L, Shi J, Gorman MF, Luo T (2020) Business analytics for intermodal capacity management. Manuf Serv Oper Manag 22(2):310–329
Goverde RM (2010) A delay propagation algorithm for large-scale railway traffic networks. Transp Res Part C Emerg Technol 18(3):269–287
Leachman RC, Jula P (2012) Estimating flow times for containerized imports from Asia to the United States through the Western rail network. Transp Res Part E Logist Transp Rev 48(1):296–309
Li L, Negenborn RR, De Schutter B (2015) Intermodal freight transport planning: a receding horizon control approach. Transp Res Part C Emerg Technol 60:77–95
Markovic N, Milinkovic S, Tikhonov KS, Schonfeld P (2015) Analyzing passenger train arrival delays with support vector regression. Transp Res Part C Emerg Technol 56:251–262
Nash A, Huerlimann D (2004) Railroad simulation using OpenTrack. Comput Railw 9:45–59
Özekici S, Sengör S (1994) On a rail transportation model with scheduled services. Transp Sci 28(3):246–255
Qu W, Rezaei J, Maknoon Y, Tavasszy L (2019) Hinterland freight transportation replanning model under the framework of synchromodality. Transp Res Part E Logist Transp Rev 131:308–328
Radtke A, Hauptmann D (2004) Automated planning of timetables in large railway networks using a microscopic data basis and railway simulation techniques. Comput Railw 9:615–625
Schön C, König E (2018) A stochastic dynamic programming approach for delay management of a single train line. Eur J Oper Res 271(2):501–518
Schönemann R (2016) Scheduling rail freight node operations through a slot allocation approach. Thesis, TU Berlin
Van den Bergh J, Beliën J, De Bruecker P, Demeulemeester E, De Boeck L (2013) Personnel scheduling: a literature review. Eur J Oper Res 226:367–385
Van Riessen B, Negenborn RR, Dekker R (2016) Real-time container transport planning with decision trees based on offline obtained optimal solutions. Decis Support Syst 89:1–16
Wang WF, Yun WY (2013) Scheduling for inland container truck and train transportation. Int J Prod Econ 143(2):349–356
Yaghini M, Khoshraftar MM, Seyedabadi M (2013) Railway passenger train delay prediction via neural network model. J Adv Transp 47(3):355–368
Yuan J (2006) Stochastic modelling of train delays and delay propagation in stations. Eburon, Utrecht
Zegordi SH, Davarzani H (2012) Developing a supply chain disruption analysis model: application of colored Petri-nets. Exp Syst Appl 39(2):2101–2111
Zhang J, Teixeira AP, Soares CG, Yan X, Liu K (2016) Maritime transportation risk assessment of Tianjin port with Bayesian belief networks. Risk Anal 36(6):1171–1187
Zhao J, Frumin M, Wilson N, Zhao Z (2013) Unified estimator for excess journey time under heterogeneous passenger incidence behavior using smartcard data. Transp Res Part C Emerg Technol 34:70–88
Acknowledgements
Open Access funding provided by Projekt DEAL. The authors would like to thank all dedicated experts who were available for interviews, especially the professionals from DB Cargo AG who are partners in the SMECS project alongside the Technical University of Berlin and Kühne Logistics University. The research project SMECS is the basis for the presented research. The project is funded by the German Federal Ministry of Transport and Digital Infrastructure as part of the IHATEC program for the development of innovative port technologies. Further recognition goes to the data providers DB Netz AG, DB Cargo AG, Deutsche Umschlaggesellschaft Straße-Schiene mbH, TFG Transfracht GmbH and Deutscher Wetterdienst.
Author information
Authors and Affiliations
Corresponding author
Additional information
Accepted after one revision by Witold Abamowicz.
Rights and permissions
Open Access This article is licensed under a Creative Commons Attribution 4.0 International License, which permits use, sharing, adaptation, distribution and reproduction in any medium or format, as long as you give appropriate credit to the original author(s) and the source, provide a link to the Creative Commons licence, and indicate if changes were made. The images or other third party material in this article are included in the article's Creative Commons licence, unless indicated otherwise in a credit line to the material. If material is not included in the article's Creative Commons licence and your intended use is not permitted by statutory regulation or exceeds the permitted use, you will need to obtain permission directly from the copyright holder. To view a copy of this licence, visit http://creativecommons.org/licenses/by/4.0/.
About this article

Cite this article
Balster, A., Hansen, O., Friedrich, H. et al. An ETA Prediction Model for Intermodal Transport Networks Based on Machine Learning. Bus Inf Syst Eng 62, 403–416 (2020). https://doi.org/10.1007/s12599-020-00653-0
Received:
Accepted:
Published:
Issue Date:
DOI: https://doi.org/10.1007/s12599-020-00653-0