
Abstract
Many manufacturing systems need more than one type of resource to co-work with. Commonly studied flexible job shop scheduling problems merely consider the main resource such as machines and ignore the impact of other types of resource. As a result, scheduling solutions may not put into practice. This paper therefore studies the dual resource constrained flexible job shop scheduling problem when loading and unloading time (DRFJSP-LU) of the fixtures is considered. It formulates a multi-objective mathematical model to jointly minimize the makespan and the total setup time. Considering the influence of resource requirement similarity among different operations, we propose a similarity-based scheduling algorithm for setup-time reduction (SSA4STR) and then an improved non-dominated sorting genetic algorithm II (NSGA-II) to optimize the DRFJSP-LU. Experimental results show that the SSA4STR can effectively reduce the loading and unloading time of fixtures while ensuring a level of makespan. The experiments also verify that the scheduling solution with multiple resources has a greater guiding effect on production than the scheduling result with a single resource.
Introduction
Since the early 1960s, the job shop scheduling problem (JSP) has been considered as one of the most important NP-hard combinatorial optimization problems. The flexible job shop scheduling problem (FJSP), which is an extension of JSP, increases the flexibility and complexity of scheduling (Xie et al. 2019). The real production environment, such as production conditions and customer requirements, becomes more and more complex with the increasing popularity of personalized requirements. A growing number of authors have paid attention to the actual production problems and developed many scheduling approaches for FJSP (Gao and Pan 2016; Gong et al. 2018a, b; Costa et al. 2020). Most of them, nevertheless, ignored the important influence of fixtures, such as loading and unloading time, which is an essential part in the production time and should be therefore not neglected.
Among recent studies, most scheduling studies only focus on the machine resource (Wu and Wu 2017; Xie et al. 2019; Li et al. 2019; Nesello et al. 2018). Jobs, however, need to be processed with not only machines but also other types of resource, such as fixtures and measuring tools. Such a scheduling problem is referred to as a multi-resource constrained scheduling problem, which exists ubiquitously in many production environments. In the studies related to this kind of scheduling problem, most authors focus on the constraints of machine and worker resource (Alejandro et al. 2020), and few consider the constraints of fixture resources in the scheduling solution (Costa et al. 2020). However, fixtures are an indispensable tool for fixing and locating jobs on machines. Especially in some types of workshops, some fixtures are unique for typical jobs. During scheduling such job shops, the scheduling solution can be executed only if both the machine and fixture resources are considered. This gap motivates this study.
According to the statistics from the International Association of Production and Research, 95% of the time during processing is consumed in the non-processing process (Wang 2005). These non-processing processes do not create value (Allahverdi 2015). Efficiently using the production resources, reducing non-processing time and improving production efficiency have become a challenge for practitioners and academia. In the production, the complex processing technology and the constant change of fixtures on machines cause frequently load and unload the fixture resources, which takes a large amount of non-processing time and a waste of resources. Exploring the ways to reduce the setup time of production is an important part of the research in the relevant literature. Moreover, in the past research process, the setup time is considered as a whole, which does not conform to the reality of production. In this paper, we divide the setup time of fixture into loading time and unloading time, and propose a similarity-based scheduling algorithm for setup-time reduction (SSA4STR).
Up to now, a variety of models have been developed in various production environments and different algorithms have been designed to study the multi-resource scheduling problem and the scheduling problem considering setup time respectively. However, in the study of the multi-resource scheduling problem, most considered the machine and worker resources (Costa et al. 2020), but few consider the fixture resource. In terms of setup time, the setup time between jobs used to be studied as a whole, few studied the loading and unloading of fixture separately. This motivates us to study the multi-resource scheduling problem with fixture and machine resources, and consider the loading and unloading time of the fixtures. For convenience, we define the problem thereafter in this study as the dual resource flexible job shop scheduling problem with consideration of loading and unloading of fixtures (DRFJSP-LU). Considering the excellent performance of the non-dominate sorting genetic algorithm II (NSGA-II) algorithm (Wu and Sun 2018), we proposed an NSGA-II to solve this problem in our previous study (Wu et al. 2020). For a further study, we improve the NSGA-II and propose an improved NSGA-II integrating SSA4STR to reduce the loading and unloading time in this paper. The main contributions of this paper are as follows:
-
(1)
A new method that defines the similarity of resource requirement among different operations is proposed;
-
(2)
A resource requirement similarity-based scheduling algorithm for setup-time reduction (SSA4STR) is developed;
-
(3)
An improved non-dominated sorting genetic algorithm II integrating SSA4STR is presented.
The remainder of this paper is structured as follows. “Literature review” section reviews the related literatures in recent years. “The model of DRFJSP-LU” section introduces the DRFJSP-LU and formulates a mathematical model. “The calculation of resource requirement similarity” section proposes the calculation of the resource requirement similarity. “The non-dominated sorting genetic algorithm II” section improves an improved NSGA-II integrating a SSA4STR. “Case study” section reports the case study. “Conclusions” section concludes the paper.
Literature review
The multi-resource constrained scheduling problem is more complicated than the single resource one (Alejandro et al. 2020). Existing researches have studied shop scheduling problems under different resource constraints. Costa et al. (2020) studied a flexible job shop scheduling problem considering machines and workers, but did not consider the time needed to shift workers. Gong et al. (2018a, b) considered the processing time, green production and worker skill simultaneously, established a multi-objective dual resource constraint model, and solved the problem with the non-dominated sorting genetic algorithm. Andrade-Pineda et al. (2019) studied a novel dual-resource constrained flexible job-shop problem and considered the influence of workers’ proficiency. Marichelvam et al. (2020) studied a multi-stage hybrid flow shop scheduling problem with identical parallel machines at each stage with the effect of human factors under consideration. The learning and forgetting effects of labors at different skill levels were considered. Li et al. (2016) considered machines and heterogeneous workers, and added dynamic scheduling and worker fatigue in their study of the scheduling problem. Bitar et al. (2016) proposed a meta-heuristic for solving a scheduling problem with auxiliary resources in a photolithography workshop of a semiconductor plant. Gao and Pan (2016) considered three kinds of additional resources, i.e. as well as machines resource and proposed a hybrid multi-group migration bird optimization algorithm.
There is a bulk of related literatures on production scheduling in last several decades since the production scheduling theory was introduced. However, a survey has shown that 90% of the literature neglected the setup time (Allahverdi 2015). The setup time, nevertheless, has a certain impact on production scheduling in real industries, including the electronics industry, the printed circuit board manufacturing, etc.
The setup time can be divided into two categories: the sequence-dependent setup time and the sequence-independent setup time.
-
(1)
Sequence-dependent setup time is related to the pre-processing operation. For example, in solving the dynamic flow shop problem, Heger et al. (2016) considered sequence-dependent setup time by dynamically adjusting the parameters of the scheduling rules. Benkalai et al. (2017) used the migration bird algorithm to solve the permutation flow shop scheduling problem, considering sequence-dependent setup time. Li et al. (2019) proposed an elitist non-dominated sorting hybrid algorithm for the multi-objective flexible job shop scheduling problem with sequence-dependent setup times. Naderi et al. (2009) investigated flexible flow line problems with sequence dependent setup times and proposed a novel variable neighborhood search algorithm. Yuan et al. (2020) developed a mixed integer linear programming model for the flow shop group scheduling problem where both sequence-dependent setup time between groups and round-trip transportation time between machines are considered. They proposed an efficient co-evolutionary discrete differential evolution algorithm to solve this problem. Nesello et al. (2018) proposed a single-machine scheduling problem with periodic maintenance and sequence-dependent setup times. Wu et al. (2020) proposed a NSGA-II approach to solve the flexible job shop dual resource scheduling problem considering fixture loading and unloading.
-
(2)
Sequence-independent setup time is only related to the current processing operation. Aydilek et al. (2017) proposed a new hybrid simulated annealing insertion algorithm in the context of two-stage assembly shop by considering the sequence-independent setup time. It had been verified that the proposed algorithm shares similar performance with the algorithm of self-adaptive differential evolution which has the best performance for such a problem. Mutu and Eren (2020) studied the single machine scheduling problem with sequence-independent setup times and time-dependent learning and forgetting effects. Aldowaisan and Allahverdi (2015) proposed an improved genetic algorithm and an improved simulated annealing algorithm for the flow shop scheduling problem where the sequence-independent setup time is considered.
To sum up, the multi-resource scheduling problem mainly considers machine resources and worker resources, and there is scarcity of literature that studies both machine and fixture resources. Among the existing studies, a small percentage of the studies that take into account the setup time, and the studies that divide the setup time into loading and unloading time are inadequate.
The model of DRFJSP-LU
Problem description
The dual-resource constrained flexible job shop scheduling problem considering loading and unloading (DRFJSP-LU) can be described as follows (Wu et al. 2020): there are |I| jobs waiting to be processed, and each job i is composed of Ji operations. There are M machines and F fixtures available for processing. Each job is processed on machines following a pre-defined order. Each operation can be processed on more than one available machine, and the processing time on different machines is different. The job needs to be fixed with a specific fixture during processing, and each operation can be fixed with one of the available fixtures. A job can only be processed on one machine with one fixture at a time. The setup time is sequence-independent. A fixture needs to be loaded onto the machine at the beginning of processing and unloaded from the machine after processing. The loading and unloading time of the fixture on different machines is different, too. The task of scheduling is first to select a machine and a fixture for each operation and then determine the processing sequence on the selected machine to optimize the makespan and the setup time simultaneously.
Some assumptions are as follows:
-
(1)
Each machine can only process one job at a time.
-
(2)
Each fixture can only process one job at a time.
-
(3)
The processing time for each operation is determined and known in advance.
-
(4)
Once processing has begun on a machine, it cannot be interrupted until the processing is completed.
-
(5)
The processing of an operation cannot be performed until its preceding operation is completed.
To make it easier to understand, we give an example of DRFJSP-LU in Tables 1 and 2, respectively. In Table 1, the data in the first row is the available machine indexes for each operation. The data in the second row is the available fixture indexes for each operation. In Table 2, the data is the loading/unloading time for each fixture.
Notations
Some notations are listed below before formulating DRFJSP-LU.
I | Set of jobs indexed by i, i = 1,2,…,|I| |
M | Set of machines indexed by m, m = 1,2,…,|M| |
F | Set of fixtures indexed by f, f = 1,2,…,|F| |
Ji | Set of operations of job i indexed by j, \( j = 1,2, \ldots ,\left| {\varvec{J}_{\varvec{i}} } \right| \) |
Oij | j-th operation of job i |
tijm | Processing time of operation \( O_{ij} \) on machine m |
\( ST_{ij} \) | Starting time of operation \( O_{ij} \) |
\( ET_{ij} \) | Ending time of operation \( O_{ij} \) |
\( s_{fm} \) | Loading time of fixture f on machine m |
\( d_{fm} \) | Unloading time of fixture f on machine m |
\( sd_{ij} \) | Setup time of operation \( O_{ij} \) |
C | Makespan |
T | Sum of setup time |
\( x_{ijm} \) | \( x_{ijm} = 1, \) if the operation \( O_{ij} \) is processed on machine m; otherwise, \( x_{ijm} = 0 \) |
\( y_{ijf} \) | \( y_{ijq} = 1, \) if the operation \( O_{ij} \) is fixed by fixture f; otherwise, \( y_{ijf} = 0 \) |
\( A_{ijm} \) | \( A_{ijm} = 1, \) if the operation \( O_{ij} \) can be processed on machine m; otherwise, \( A_{ijm} = 0 \) |
\( B_{ijf} \) | \( B_{ijf} = 1, \) if the operation \( O_{ij} \) can be fixed by fixture f; otherwise, \( B_{ijf} = 0 \) |
\( w_{ijgh} \) | \( w_{ijgh} = 1 \), if the operation \( O_{ij} \) is the precedence of the operation \( O_{gh} \) on the same machine with the same fixture; otherwise, \( w_{ijgh} = 0 \) |
\( z_{ijgh}^{1} \) | If the operation \( O_{ij} \) is the precedence of the operation \( O_{gh} \) on the same processing machine, \( z_{ijgh}^{1} = - 1 \); if the operation \( O_{gh} \) is the precedence of the operation \( O_{ij} \) on the same processing machine, \( z_{ijgh}^{1} = 1 \); otherwise, \( z_{ijgh}^{1} = 0 \) |
\( z_{ijgh}^{2} \) | If the operation \( O_{ij} \) is the precedence of the operation \( O_{gh} \) on the same fixture, \( z_{ijgh}^{2} = - 1 \); If the operation \( O_{gh} \) is the precedence of the operation \( O_{ij} \) on the same fixture, \( z_{ijgh}^{2} = 1 \); otherwise, \( z_{ijgh}^{2} = 0 \) |
Formulation of DRFJSP-LU
In the production, the desire for the decision makers is to complete all processing tasks effectively and efficiently. Besides, although the loading and unloading time for a fixture may not create any value, a fixture is an indispensable resource during processing. In order to reduce the makespan, the decision maker will prioritize to select machine that can finish processing earliest when scheduling the subsequent operations, but does not consider whether the fixture installed on the machine is available. If the fixture on the machine is not available for the subsequent operation, the fixture needs loading and unloading. This results in the increasing of setup time. Hence it is necessary to take setup time into consideration when scheduling. The objectives of the mathematical model in this study are therefore to minimize the makespan and the setup time of the fixtures simultaneously.
The DRFJSP-LU can be formulated as follows:
Equations (1) and (2) are two objectives, i.e. to minimize the makespan and to minimize the setup time. Equation (3) is to compute the setup time of operation \( O_{ij} \), which is the sum of the loading time (i.e. the first part of the formulation) and the unloading time (i.e. the second part of the formulation) of the fixture employed in this process. Equation (4) guarantees that each operation can only be processed on one machine. Equation (5) guarantees that only one fixture can be used in one operation. Equation (6) imposes the constraint that an operation can only be processed by one of the available machines. Equation (7) imposes the constraint that the fixture used by operation \( O_{ij} \) must be available for the operation. Equation (8) ensures that all operations must meet process constraints. Equation (9) indicates that the starting time must be more than zero. Equation (10) is to compute the completing time of operation \( O_{ij} \). Equation (11) indicates that the same machine can only process a job at the same time. Equation (12) constrains that the same fixture can only hold one job at a time. Equations (13)–(18) are the decision variables.
The calculation of resource requirement similarity
Resource requirement similarity
If the fixtures for the adjacent operations on one same machine are different, the worker needs to unload one fixture and load another fixture, resulting in too long non-processing time. Therefore, in order to minimize the loading and unloading of the fixture and reduce the setup time, the fixture resources required by the adjacent operations on machines should be the same. In reality, jobs in a workshop normally have some similar characters (Erromdhani et al. 2012). In existing research, the measurement methods for the similarity between jobs are different (Yin and Yasuda 2006). Most of them defined the similarity between jobs as the similarity of their processing, and calculated it according to the processing route of the jobs. The similarity of the processing not only relates to the operations included in the processing route, but also relates to the sequence of the operations. Ho et al. (1993) proposed a processing route similarity algorithm based on compatibility index, which analyzed the same number of operations between processing routes A and B from the forward and reverse directions, using the ratio of the same number of operations and the length of processing route as a similarity. Choobineh (1988) proposed a similarity algorithm for the hybrid processing route. The sequence similarity was proposed by Irani and Huang (2000) and was the longest common subsequence to transform one sequence into another with the minimum number of substitutions, insertions and deletions. In addition, other factors are taken into consideration according to the processing technology. Goyal et al. (2013) developed a novel method to evaluate similarity considering bypassing moves and idle machines according to the longest common subsequence. Alhourani (2013) constructed a new comprehensive similarity, including the processing route, process sequence, batch, shared equipment, etc.
As can be seen from the above discussion, although some methods to calculate the processing similarity between jobs have been designed, the definitions of the similarity in the existing research mostly focus on the similarity between jobs. Few authors considered the similarity between operations. Moreover, most of the research calculates the similarity according to the processing route, regardless of the similarity of resources requirement, which in turn affects the setup time. Hence, we propose a method to define the similarity of the resource requirements for operations in the following section.
The representation for the similarity
The required resources can be classified into 2 categories, machines and fixtures. Each can be further split into sub-categories according to their resource requirement features. Denote the resources required for each operation are the machine resource \( M \) and the fixture resource \( F \). The machine resource has \( s_{m} \) sub-categories and the fixture resource has \( s_{q} \) sub-categories.
The binary encoding is used to indicate whether the corresponding operation can be processed by the resource. “1” represents that the operation can be processed by the corresponding resource, and “0” represents that the operation cannot be processed by the corresponding processing resource. Figure 1 shows a representation of the resource requirement similarity for operation \( O_{ij} \).

The representation of the resource requirement similarity
Where \( W_{s} \) is the value of the corresponding sub-category. The value of \( W_{s} \) is as shown in Eq. (19).
The example mentioned in Table 1 can be encoded to be a matrix W as shown in (20). O11 = [1 1 0 0 0 1 0 1 0 1] means that the first operation of the job 1 can be processed by machine 1 or machine 2, and it can be fixed by fixture 1, fixture 3 or fixture 5, respectively.

The calculation of the similarity
The resource requirement similarity is calculated according to the Jaccard coefficient (Sujoy et al. 2019). The Jaccard coefficient is the ratio of the number of intersections to the number of unions for two elements. It does not consider the size of the specific difference between individuals, and only pays attention to whether there are common features among elements. Denote two operations as A and B, respectively. The calculation formula of the Jaccard coefficient is shown in Eq. (21).
Since the encoded process has Boolean attributes, \( f_{00} \) is the number of attributes that both equals to 0, \( f_{11} \) is the number of attributes that both equal to 1, \( f_{01} \) is the number of attributes that A equals to 1 and B equals to 0 and \( f_{10} \) is the number of attributes that A equals to 0 and B equals to 1. Hence, the Jaccard coefficient can be calculated according to Eq. (22).
For example, the resource requirement similarity of \( O_{11} \) and \( O_{12} \), as shown in Table 1, can be calculated as follows:
The resource requirement similarity of each operation is calculated in the same way and the similarity matrix W can be obtained as shown in Eq. (24).

The non-dominated sorting genetic algorithm II
The details of the NSGA-II
The dual resource scheduling problem has been proved to be a typically NP-Hard problem (Yuan et al. 2020), which is generally solved by meta-heuristics, such as the genetic algorithm (Paksi and Ma’ruf 2016), the fruit fly optimization algorithm (Zheng and Wang 2016), and the particle swarm algorithm (Zhang et al. 2017). DRFJSP-LU takes the loading and unloading time of fixture, the resource requirement similarity, and the dual resources into consideration, which is obviously strongly NP-hard. Since the NSGA-II performs well in solving multi-objective optimization problems, we employ the NSGA-II to search the optimal solution for the DRFJSP-LU.
The representation for DRFJSP-LU
The operation-based encoding method (Wu and Sun 2018) is employed in the paper, which is the classical encoding method for FJSP. The example shown in Fig. 2 is a representation of the case in Table 1.

An example for encoding
The SSA4STR for decoding
The DRFJSP-LU can be divided into three sub-problems: machine assignment, fixture assignment, and job sequencing. When solving them, one needs to consider the conflict among different types of resource, including the conflict among machines and that among fixtures. When one fixture is loaded to or unloaded from one machine, the loading and unloading time cannot usually be ignored, especially for some special fixtures that need a little time to load or unload. The encoding method in “The representation for DRFJSP-LU” section only considers the scheduling sequence, while neither the machine nor the fixture is determined for each operation. Hence, the machine and the fixture for each operation should be determined when decoding. Based on the gap extrusion method (Wu and Sun 2018), this paper proposes a scheduling algorithm considering the resource requirement similarity and the loading/unloading time of fixture simultaneously.
The core of the gap extrusion method is to insert the current operation into the time gap between the scheduled operations if possible. That is, if the start time of a gap is greater than the completion time of the preceding operation and the length of the gap meets the processing time of the current operation, it is preferred to insert the current operation into the gap for processing. The details of the gap extrusion method are described in Wu and Sun (2018). Motivated by the gap extrusion method, we propose a SSA4STR to take the machines and the fixtures into account jointly. The main idea of the SSA4STR are as follows.
-
(1)
Rank the operations according to their similarity so that those with similarity value higher than a given threshold will be scheduled successively.
-
(2)
For each operation, choose the machine on which there is both an available gap and an available fixture to reduce the loading and unloading time.
Let’s explain why the similar operations are scheduled successively in the SSA4STR first. Take the cases in Tables 1 and 2 as an example. The processing time for each operation is given in Table 3. Consider the individual representation shown in Fig. 2. If we decode the individual without considering the similarity between operations, the scheduling solution is as shown in Fig. 3. The X-axis represents time and the Y-axis represents machines. The numbers in each block “a-b-c” indicates the b-th operations of job a is fixed with fixture c, e.g. “2-3-4” indicates that the third operation of job 2 is fixed with fixture 4. The rectangles in the front of and at the back of each block indicate the loading time and the unloading time, respectively. From Fig. 3, the makespan is 36.3 and the total times for the loading and unloading is 7 and the amount is 14.3. Figure 4 gives the ranking process.

The scheduling solution with the gap extrusion method

An example of how the ranking algorithm works
However, if we use the SSA4STR to decode the chromosome, the genes indicating operations are ranked first according to the similarity and the threshold. Only those with similarity value larger than the threshold should be re-ranked. The similarity value is computed by Eq. (22) to form the similarity matrix as shown in Eq. (24). Assume the threshold value is 0.2 and take the chromosome in Fig. 2 as an example. The ranking algorithm is as follows.
-
Step 1 The first operation (\( {\text{O}}_{ 3 1} ) \) in the original chromosome is still the first one in the ranked chromosome.
-
Step 2 Search the similar operations with operation \( {\text{O}}_{ 3 1} \) with similarity value larger than the threshold. We obtain operations \( {\text{O}}_{ 1 3} \), \( {\text{O}}_{ 2 1} \), and \( {\text{O}}_{ 2 3} \), respectively. Because the immediate predecessor operations for operations \( {\text{O}}_{ 1 3} \) and \( {\text{O}}_{ 2 3} \) have not been scheduled, the current available operation is only operation \( {\text{O}}_{ 2 1} \). If there is more than one available operation, choose the one whose similarity value is the largest.
-
Step 3 Repeat step 2 for the other operations in the original chromosome. For example, for operation \( {\text{O}}_{ 2 1} \), repeat the process in step 2 to search its most similar operation and we get operation \( {\text{O}}_{ 3 2} \). During searching the similar operations, if there is no operations with similarity value larger than the threshold, choose the first un-scheduled operation. For example, for operation \( {\text{O}}_{ 1 2} \), no operation whose similarity value is more than 0.2, so we choose operation \( {\text{O}}_{ 3 3} \) because it is the first un-scheduled operation in the original chromosome.
Now, we generate a scheduling solution from the ranked chromosome with the gap extrusion method. The Gantt chart is shown in Fig. 5. It can be seen that the makespan is 29, the times of the loading and unloading is 6, and the total amount of the loading and the unloading time is 12.5. By comparing the two solutions in Figs. 3 and 5, the solution generated with SSA4ST can significantly reduce the loading and unloading time and the makespan.

the scheduling solution with SSA4STR
The detailed steps (Fig. 6) to generate a scheduling solution with SSA4STR are as follows:
-
Step 1 Input a chromosome and rank its gene sequence with the ranking algorithm to get a ranked chromosome. Record the length of the chromosome as L. Set i = 1.
-
Step 2 Repeat (for each gene i in the ranked chromosome).
-
Step 2.1 Determine the corresponding operation of gene i according to the encoding method.
-
Step 2.2 Search the available combination of the machines and fixtures. Record the number of combination as n. Set j = 1.
-
Step 2.3 Repeat (for each combination j).
-
Step 2.3.1 Check whether the machine in combination j has been occupied. If yes, go to step 2.3.2; Go to step 2.3.3, otherwise.
-
Step 2.3.2 Check whether the fixture in combination j has been occupied. If yes, schedule the operation with the rule for Case 4; Schedule the operation with the rule for Case 3, otherwise.
-
Step 2.3.3 Check whether the fixture in combination j has been occupied. If yes, schedule the operation with the rule for Case 2; Schedule the operation with the rule for Case 1, otherwise.
-
Step 2.3.4 Record the makespan and setup time for combination j and let j = j + 1. If j < n, go back to step 2.3; go to step 2.4, otherwise.
-
-
Step 2.4 Select the combination which can ensure both the makepan and the setup time simultaneously optimal. Let i = i + 1. If i ≤ L, go back to step 2; go to step 3, otherwise.
-
-
Step 3 All the genes have been scheduled and the output the scheduling solution,

The flowchart of the SSA4STR
Cases 1–4 are four cases in terms of the status of machines and fixture. In different cases, the scheduling method is different, with which the position of the current operation, the loading time and unloading time for the fixture is determined.
-
Case 1 In this case, neither the selected machine nor the selected fixture is occupied. The fixture should be loaded onto the machine first, and the start time of the current operation is zero (Wu et al. 2020).
-
Case 2 In this case, the selected machine has not been occupied by other operations, but the selected fixture has already been occupied. Hence, we should first find the operation that is occupying the selected fixture, and then calculate the idle time gaps for the fixture. Choose the idle time gap into which the current operation can be inserted. The fixture should be unloaded first from the previous machine and then loaded on the selected machine. If the two machines are the same, the unloading and the unloading time of the fixture is saved (Wu et al. 2020).
There are three sub-cases for this case, as shown in Fig. 7 (Wu et al. 2020). The time of each operation can be broken down into three parts: loading time, processing time and unloading time. The operation in green [i.e. block “1-2-3” in (a), block “3-1-3” in (b) and (c)] is currently being scheduled. The block in brown is the extra loading or unloading time spent. In Fig. 7a, the selected fixture (i.e. fixture 3) has been loaded onto the other machine (i.e. machine 2), and it is occupied in the gap time. Hence, the fixture should be unloaded from the machine (i.e. machine 2) first, and then be loaded onto the selected machine (i.e. machine 1) to process the current operation (i.e. operation O12). When the processing finishes, it should be unloaded from the selected machine (i.e. machine 1) and loaded back to machine 2 again to avoid interfering with the scheduled operations’ processing. In Fig. 7b and c, fixture 3 is idle during the gap time, so it can be loaded on the selected machine (i.e. machine 1) directly.
-
Case 3 The selected machine is occupied but the selected fixture is not occupied. First find the operations that have been scheduled on the selected machine and then calculate the idle time gaps in the machine. Choose the idle time gap into which the current operation can be inserted. The fixture is loaded first on the machine and then unloaded from the machine after processing.

Three examples for the sub-cases of Case 2 (adapted from Wu et al. 2020)
There are three sub-cases for case 3, as shown in Fig. 8 (Wu et al. 2020). In Fig. 8a and b, the operation in green (i.e. block “3-1-3”) is the currently being scheduled. The selected fixture (i.e. fixture 1) is not occupied on the selected machine (i.e. machine 2). The selected fixture (i.e. fixture 1) can be loaded on the selected machine (i.e. machine 2) directly and unloaded from the selected machine (i.e. machine 2) after processing. In Fig. 8c, other fixture (i.e. fixture 3) has been loaded on the selected machine (i.e. machine 2) in the gap time, so it (i.e. fixture 3) should be unloaded first and loaded again for processing the operation “2-2-3” after the current operation (i.e. block “3-1-1”). The selected fixture (i.e. fixture 1) for the current operation (i.e. block “3-1-1”) should be loaded first on and then unloaded from the selected machine (i.e. machine 2).

Three examples for the sub-cases of case 3 (adapted from Wu et al. 2020)
-
Case 4 Both the selected machine and the selected fixture are occupied. This case is the most complicated. Hence, we develop a scheduling algorithm. The steps are as follows (Wu et al. 2020):
-
Step 1 Denote the selected machine as m, the selected fixture as f, the completing time for each operation as \( \varvec{C}_{\varvec{P}} \), the idle time gap of m and f as \( \varvec{T}_{\varvec{m}} \) and \( \varvec{T}_{\varvec{f}} \), respectively, the fixtures on machine \( m \) at a certain moment as \( \varvec{M}_{\varvec{f}} \), and the machines occupying fixture \( f \) at a certain moment as \( \varvec{F}_{\varvec{m}} \).
-
Step 2 For the currently scheduled operation \( O_{ij} \), find the completing time \( ET_{{i\left( {j - 1} \right)}} \) of its predecessor operation \( O_{{i\left( {j - 1} \right)}} \) in \( \varvec{C}_{\varvec{P}} \). The time \( ET_{{i\left( {j - 1} \right)}} \) is the earliest start time for processing operation \( O_{ij} \). Get the processing time \( t_{ijm} \) of operation \( O_{ij} \), the loading time \( s_{fm} \) and the unloading time \( d_{fm} {\text{for fixture }}f \) from the input data set.
-
Step 3 The intersection of the idle time gaps both in machine \( m \) and fixture \( f \) is denoted as \( \varvec{T}_{{\varvec{MF}}} , \) which can be calculated according to \( \varvec{T}_{\varvec{m}} \) and \( \varvec{T}_{\varvec{f}} \).
-
Step 4 For the idle time gap in \( \varvec{T}_{{\varvec{MF}}} \), there are seven subcases of the loading or unloading for fixture f. To show it clearly, we use a decision tree (Fig. 9) to describe the subcases. Modify the loading and unloading status of according to \( \varvec{M}_{\varvec{f}} \) and \( \varvec{F}_{\varvec{m}} \). Denote the sum of the processing time \( t_{ijm} \), the loading time \( s_{fm} \) and the unloading time \( d_{fm} \) of fixture \( f \) is denoted as \( t_{all} \). If the common idle time gap in \( \varvec{T}_{{\varvec{MF}}} \) is more than \( t_{all} \), the operation \( O_{ij} \) can be processed in the gap. Append operation \( O_{ij} \) at the end of the selected machine and the selected fixture, otherwise.
Fig. 9 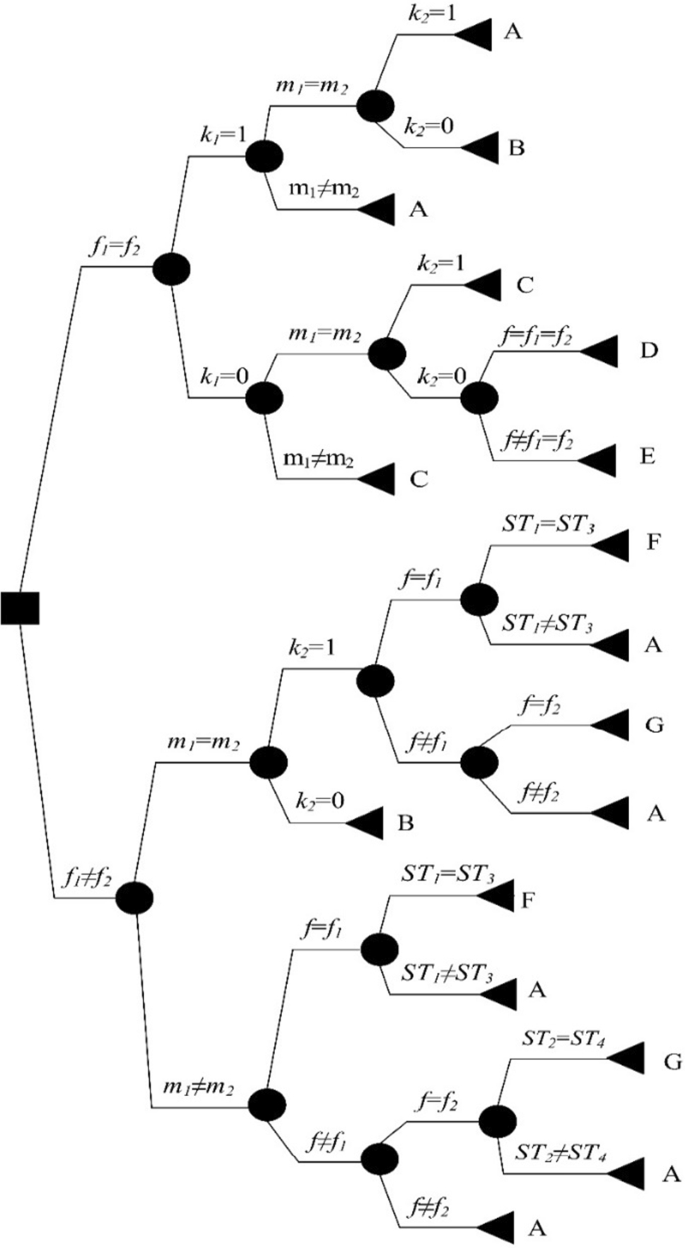
The decision tree for case 4
-

Figure 9 shows the decision tree to determine whether the loading and unloading of fixture in the gap needs modifying. \( f_{1} \) is the fixture loaded before the idle time gap on the machine \( m \). \( f_{2} \) is the fixture loaded after the idle time gap on the machine \( m \). \( k_{1} \) is a state variable for fixture \( f_{1} \). \( k_{1} = 1 \) indicates that there is an unloading process for fixture \( f_{1} \) and a loading process for fixture \( f_{2} \) while \( k_{1} = 0 \) means fixture \( f_{1} \) has not been unloaded and there is no loading process for fixture \( f_{2} \) (this case only exists when \( f_{1} = f_{2} \)) .\( k_{2} \) is another state variable for fixture \( f_{2} \). \( k_{2} = 1 \) indicates there is an unloading process for fixture \( f_{2} \) and a loading process for fixture \( f_{1} , \) while \( k_{2} = 0 \) implies fixture \( f_{2} \) has not been unloaded and there is no loading process for fixture \( f_{1} \). \( m_{1} \) represents the machine where fixture f is loading before the idle time gap and \( m_{2} \) represents the machine where fixture f is loading after the idle time gap. The start time of operations in machine m before and after the gap are denoted as \( ST_{1} {\text{and }}ST_{2} \), respectively, and the start times of operations that are fixed by fixture f before and after the gap are denoted as \( ST_{3} {\text{and }}ST_{4} \), respectively.
There are seven resulting nodes in the decision tree, which determines how to schedule machines and fixtures when dealing with operation Oij. The details of the resulting nodes are as follows (Wu et al. 2020).
-
(1)
Result A. Load fixture f, insert operation Oij and then unload fixture f.
-
(2)
Result B. Unload fixture f from machine \( m_{1} \), load fixture f on machine m, insert operation Oij, unload fixture f from machine m and load fixture f on machine \( m_{2} \).
-
(3)
Result C. Unload fixture \( f_{1} \) from machine \( m \), load fixture f on machine m, insert operation Oij, unload fixture f from machine m and load fixture \( f_{2} \) on machine m.
-
(4)
Result D. Insert operation Oij in the idle time gap directly.
-
(5)
Result E. Unload fixture \( f \) from machine \( m_{1} \). Unload fixture \( f_{1} \) from machine \( m \), load fixture f on machine m, insert operation Oij, unload fixture f from machine m and load fixture \( f_{2} \) on machine m. Load fixture \( f \) on machine \( m_{2} \).
-
(6)
Result F. Keep fixture \( f_{1} \) loading on machine m before the idle time gap, insert operation Oij, and unload fixture \( f_{1} \) (\( f_{1} = f \)).
-
(7)
Result G. Load fixture f on machine m, insert operation Oij, and the loading process after the idle time gap is saved on machine m (\( f_{2} = f \)).
Crossover and mutation
New gene combinations can be generated with crossover. The local search ability of the algorithm is improved with mutation. The search direction and strength of different operators are different. Hence, a crossover operator pool and a mutation operator pool are established to search the solution space as comprehensively as possible. The crossover operators are selected from the literature (Akay and Yao 2013), including linear order crossover, position-based crossover, and sequence-based crossover. The mutation operators include inversion, swap, displacement, and insertion. One of these operators is randomly selected in each iteration.
The non-dominated ranking
The non-dominated ranking of the population is determined by the non-dominated level. A non-dominated solution is a solution that is not dominated by any other solutions. The offsprings are mixed with their parent population, and the non-domination level of each individual is determined by the crowding degree that describes the distribution of a solution with other solutions in the same non-dominated level.
According to Deb et al. (2002), the crowding degree, crowd, of the individual \( \varvec{X}_{i} \) is calculated with the Eq. (25).
where K is the number of objectives, \( f_{max}^{\left( k \right)} \) is the maximum value of the k-th objective, \( f_{min}^{\left( k \right)} \) is the minimum value of the k-th objective, \( f^{\left( k \right)} \left( {i + 1} \right) \) and \( f^{\left( k \right)} \left( {i - 1} \right) \) are the k-th objective of \( \varvec{X}_{i + 1} \) and \( \varvec{X}_{i - 1} \), respectively.
The next generation is selected from the mixed population according to the non-dominated level and the crowding degree. The steps are as follows (Wu et al. 2020).
-
Step 1 Individuals with the minimum non-dominated level enter the next generation directly. If the amount is less than the required population size, go to Step 2; otherwise, two individuals are randomly selected, and the individuals with the larger crowding degree are selected to enter the next generation until the number of individuals is equal to the population size.
-
Step 2 Randomly select two individuals from the remaining individuals, and the individual with a small non-dominated level enters the next generation; if the non-dominated levels of two individuals are same, the individual with a larger crowding degree enters the next generation preferentially until the number of individuals in the next generation is equal to the population size.
Individuals with a small non-dominated level are selected so that better individuals in the population are retained, and individuals with a larger crowding degree are chosen to ensure the diversity of the population.
Case study
The design of experiments
All experiments were conducted in a desktop computer with an Intel Core i5-7200U, 2.50 GHz CPU, 8.00G RAM, Win10 64 OS, and Matlab©.
The parameters for the NSGA-II are set as follows: the population size Num = 50, the number of iterations Iterations = 500, the crossover probability pc = 0.8, and the mutation probability pm = 0.2.
The experimental instances are generated from the Brandimarte instances (Brandimarte 1993). The number of fixtures is the same as the number of machines. Mmax is the maximum number of available machines for the operation, the number of available fixtures for the operation follows the uniform distribution U[0, Mmax]. The available fixture sets are generated according to the number of fixtures randomly. The loading and unloading time follows the uniform distribution of U[0, 2]. The instances are listed in Table 4.
In order to verify the performance of the proposed algorithm and compare the difference between single and multi-resource, we design the following numerical experiments, respectively:
-
(1)
Analysis of the performance of the SSA4STR.
-
(2)
Analysis of the effect of the threshold size in the scheduling algorithm.
-
(3)
Analysis of the performance of the improved NSGA-II.
-
(4)
Analysis of the difference between scheduling solutions that fully and partially consider resource, respectively.
Analysis of the performance of the SSA4STR
The aim is to verify the optimization effect of the SSA4STR by comparing it with the makespan oriented scheduling algorithm (algorithm A for convenience) and the setup time oriented scheduling algorithm (algorithm B for convenience), respectively. The SSA4STR is represented as algorithm C for convenience. Three scheduling algorithms are employed to solve the MKF-01 problem. The results are reported in Table 5, and the comparison results of Pareto solutions are shown in Fig. 10.

The comparison of Pareto solutions with three algorithms
It can be seen from Fig. 10 that the Pareto solutions obtained with the SSA4STR outperforms those obtained with the other two scheduling algorithms. The solution obtained with the SSA4STR dominates the solutions obtained with the makespan oriented scheduling algorithm. At the same level of the makespan, the setup time of the solution obtained with the SSA4STR is shorter. Compared with the setup time oriented scheduling algorithm, although the solutions dominate each other, the makespan of the solution obtained with the setup time oriented scheduling algorithm is too long. The SSA4STR can greatly reduce the setup time while ensuring the makespan, and in that way the jobs can be finished processing efficiently.
In order to analyze these three scheduling algorithms more intuitively, the Gantt charts of the typical solutions obtained with the three scheduling algorithms (marked with circles in Fig. 10) are provided in Figs. 11, 12 and 13. The X-axis represents time, the Y-axis represents machine, the blue rectangle is the loading process of the fixture, the red rectangle is the unloading process, the number in the lower row is the job index, the number in the upper row is the fixture index, and the rectangles with the same color represent the different operations of the same job. It can be seen from Fig. 11 that the makespan oriented scheduling algorithm does not consider the setup time in scheduling, resulting in frequent loading and unloading of fixtures. Especially on machine 3, there are many non-processing processes, thus leading to a waste of time. In Fig. 12, in order to reduce the setup time, the operations are arranged as much as possible on the machine on which the available fixture is installed. This strategy leads to the unbalanced load among machines. We can see that most operations are assigned on machine 2 so that the makespan is too big. As shown in Fig. 13, the SSA4STR reduces the frequency of loading and unloading of the fixture. It can be seen that the SSA4STR can effectively balance the two optimization goals. Figure 14 shows the Gantt chart on the fixtures of Fig. 13.

The Gantt Chart with makespan oriented scheduling algorithm

The Gantt Chart with setup time oriented scheduling algorithm

The Gantt Chart on machine resource with the SSA4STR

The Gantt chart on fixture resource with the SSA4STR
Analysis of the effect of the similarity threshold size in the scheduling
In the SSA4STR, the generation of ranked chromosome depends on the size of the threshold. More operations will be adjusted in the generation of the ranked chromosome with a smaller threshold. Hence, the threshold value is vital in the scheduling algorithm. The purpose of this experiment is to determine the effect of the threshold size.
To show it clearly, the comparison of the results is shown in Fig. 15. The dotted line is the trend of the setup time with the decreasing of the threshold value referring to the coordinate axis on the left and the solid line is the trend of the makespan with the decreasing of the threshold value referring to the coordinate axis on the right. As can be seen from the Fig. 15, the size of the threshold affects the experimental results greatly. The setup time decreases with the decreasing of the threshold. When the threshold decreases to a certain level, the setup time begins to increase. Obviously, there is an inflection point for the threshold. When the threshold is large, some operations which are similar to the current operation will be arranged near to the current one. When scheduled, these operations can select the same fixtures to reduce the setup time. For the makespan, it shows an increasing trend as the threshold decreases. As a result, the introduction of the threshold trades off the makespan to reduce the setup time.

The trend of makespan and the setup time with the changing threshold
Furthermore, we study the performance of the proposed algorithm. For convenience, the algorithm, without considering similarity, is denoted as algorithm D, and the algorithm with the best threshold is denoted as algorithm E. The experimental results of the above algorithms are shown in Table 6. It can be seen that at the threshold inflection point, the increased ratio of makespan is not more than 6%, and the decreased proportion of the setup time is up to 13%. The reduction rate of the setup time is significantly greater than the increase rate of completion time. Although the makespan increases little, the decrease of the setup time can produce a greater effect on the production of the workshop than the increase of the makespan. The reduction of setup time is to reduce not only the loading and unloading times of fixtures but also the complexity of work and the operation difficulty of the processing. Therefore, it can be concluded that introducing resource requirement similarity in the scheduling algorithm can greatly reduce the setup time.
Analysis of the performance of the improved NSGA-II
To evaluate the performance of the improved NSGA-II algorithm, we develop a multi-objective differential evolution algorithm (MODE). MODE is an algorithm based on population evolution and its flowchart is shown in Fig. 16.

the flow chart of MODE
The basic idea of this algorithm is to generate a new population with differential mutation and crossover, and then select individuals from the parent–child mixed population to obtain the offspring population. The operation-based encoding method and the SSA4STR are employed in MODE algorithm. The differential evolution operator mixes the DE/best/1 strategy and the DE/rand/1 strategy. The global search ability of the MODE algorithm is good, but its local search ability is poor, so the scaling factor F is set to adaptively change with the number of iterations between [\( F_{0} \),\( 2F_{0} \)]. F has a large value in the early stage of the search, and it can fully explore the solution space. As the number of iterations increases, the value of F gradually decreases. The algorithm can retain excellent genes and avoid the best solution being destroyed. The calculation formula of F is shown in Eqs. (26) and (27), where Iterations is the maximum number of iterations, Itr is the current number of iterations, and \( F_{0} \) is the initial value of the scaling factor.
Multi-objective optimization is generally evaluated in terms of convergence, diversity and distribution uniformity. There are some indicators that are generally employed, such as contemporary distance (Gong et al. 2018a, b), hypervolume, ideal solution deviation, spread and so on. Two indicators, i.e. hypervolume and spread, are selected to measure the results in this study.
-
(1)
Hypervolume index (Ciavotta et al. 2013): The hypervolume index method is proposed by Zitzler and Thiele (1999), which indicates the volume of the hypercube enclosed by the individual and the reference point in the target space. The coordinate origin is selected as the reference point, and the two objective values are respectively normalized before calculation. A hypervolume indicator can measure the convergence of the solution set. The smaller the hypervolume index is, the better of the convergence of the algorithm is.
-
(2)
Spread index (Lu et al. 2017): The spread index evaluates the diversity and the distribution uniformity of solutions. The smaller the spread value, the better the diversity and distribution uniformity of the solution set. The calculation formula of spread is as shown in Eq. (28).
$$ SP = \sqrt {\left( {Z - 1} \right)^{ - 1} \mathop \sum \limits_{i = 1}^{Z} \left( {\bar{d} - d_{i} } \right)^{2} } $$(28)where Z is the number of the Pareto solutions, \( d_{i} \) is the Euclidean distance between solution i and the nearest solution, and \( \bar{d} \) is the average of \( d_{i} \).
The experimental results and performance indicators obtained with the MODE algorithm and the NSGA-II algorithm are shown in Table 7, including the makespan, the setup time, the hypervolume index, and the spread index, respectively. The results with the MODE algorithm are listed in the left column under each indicator, and the results with the NSGA-II algorithm are listed in the right column under each indicator. For the setup time index, the NSGA-II algorithm outperforms the MODE algorithm for 10 instances. For the makespan index, the improved NSGA-II algorithm obtains the better results for 8 instances. For each instance, better solutions are shown in bold. Therefore, the NSGA-II algorithm outperforms the MODE algorithm in the convergence, the distribution and the diversity of the solution.
Figure 17 is the comparison of the distribution of the Pareto solution, obtained by the NSGA-II algorithm and the MODE algorithm. The stars in the figure are the results from the NSGA-II algorithm, and the dots are the results from the MODE algorithm. It can be seen from Fig. 17 that most of the results obtained from the NSGA-II algorithm are better than those obtained from the MODE algorithm. Only for the MKF-09 instance, the results are similar, with the possibility of either algorithm producing better results. Therefore, the NSGA-II algorithm outperforms the MODE algorithm in general.

The comparison of Pareto set
Analysis of the differences between scheduling solutions that fully and partially consider resource, respectively
In order to test the difference between the multi-resource scheduling solution and the single-resource scheduling solution, we ignore the fixture resource and only consider machine resource.
Figure 18 shows a scheduling solution generated only if single resource (e.g. machine) for the scheduling solution shown in Fig. 13 is considered. By comparing Fig. 18 with Fig. 13, one can find that on the basis of multi-resource scheduling solution, the makespan can be reduced without considering the loading and unloading time of fixtures. But in the real production, fixtures are indispensable. If the production is carried out according to the scheduling solution that only considers the single resource, there will be a situation that the scheduling solution cannot be executed due to the occupation of the machines or fixtures. For example, job 9 is scheduled on machine 4 and fixed by fixture 2 as shown in Fig. 13. When multi-resource is considered, the production of job 9 after job 2 can avoid the loading and unloading of the fixture and the time spent on those actions can be saved. However, if the fixture resources are not considered when generating scheduling solution, job 9 can only be placed behind job 10 for processing (as shown on machine 4 in Fig. 18). When machine 4 processes job 9, fixture 2 used by job 9 is occupied by job 6 produced on machine 2. At this time, the processing of job 9 has to be stopped, which will affect the subsequent processing. Therefore, scheduling solutions considering multi-resource are more operational for actual production, though it might increase the makespan.

The scheduling solution considering single resource
Discussions
This paper proposed a similarity-based scheduling algorithm for setup-time reduction (SSA4STR) to reduce the setup time and the makespan. We compared the performance of SSA4STR with the makespan oriented scheduling algorithm and setup time oriented scheduling algorithm, respectively. The first reason that SSA4STR outperforms others is that the operation with a larger similarity is placed adjacently. In this way, the loading and unloading time is significantly reduced, and the operation can be completed efficiently while ensuring a good utilization rate of resources. Secondly, the performance of SSA4STR is greatly affected by the similarity threshold. Therefore, we obtained the trend of the makespan and setup time changing with threshold value under different instances (as shown in Fig. 15). The results show that the setup time and the makespan will increase if the threshold value is too large or too small. When the threshold is too small, the operations with the smaller similarity are arranged in the adjacent positions for processing, and the processing still needs the loading and unloading of fixture resources; otherwise, when the threshold is too large, only a small part of the operations with the larger similarity are arranged in the adjacent position for processing, and the role of SSA4STR is not fully played. Thirdly, in order to verify the good performance of NSGA-II in solving this problem, we designed an experiment to compare the performance of NSGA-II and MODE, in terms of the makespan, the setup time, the hypervolume index, and the spread index. NSGA-II outperforms MODE in the convergence, the distribution and the diversity. Finally, in order to prove the necessity for considering multiple resources when scheduling, we analyze the differences between the two scheduling solutions (Figs. 13, 18). Makespan only considering the machine resource scheduling solution is shorter than that considering multiple resources, but scheduling solution considering multiple resources is more practicable for real production.
Conclusions
In real production, it is always necessary to cooperate with multiple types of resource. Thus, the study of the multi-resource scheduling problem is of great importance. When researching into the multi-resource scheduling problem, one needs to consider the similarity of the resources between different operations, so that some unnecessary setup time can be saved. This paper proposed a similarity-based scheduling algorithm for setup-time reduction to solve the dual resource constrained flexible job shop scheduling problem, with the makespan and the loading and unloading time as objectives. The improved non-dominated sorting genetic algorithm II was employed to search the optimal solution. Experiments showed that the proposed algorithm could effectively reduce the loading and unloading time of fixtures while ensuring makespan. When the similarity equals the best threshold, the proposed algorithm can effectively reduce the loading and unloading time of fixtures. The experiment also verified that the scheduling solution with multiple resources has a greater guiding effect on production than the scheduling result with a single resource.
The managerial insights are summarized as follows. In the production operation management, the decision maker should take as much as possible constraints into account. Only in this way can the decision maker ensure that the decision is feasible and practical. Though some assumptions can make the problem much easier for solving, they doesn’t hold in practice. This paper considered machine and fixture simultaneously when making a scheduling solution, which overcomes the shortcoming of the scheduling solution where only the machine resource is considered.
However, the problem discussed in this paper only considered two types of resources: fixtures and machines. In our future research, more types of resource constraints will be taken into account, such as tool wear, workers and so on, with aims to develop more effective heuristics and algorithms to solve the problem more effectively and efficiently. Besides, other production environment should also be studied, such as the flow shop scheduling problem considering multiple types of resource.
Change history
29 October 2021
A Correction to this paper has been published: https://doi.org/10.1007/s10845-021-01859-z
References
Akay, B., & Yao, X. (2013). Recent advances in evolutionary algorithms for job shop scheduling (pp. 191–224)., Automated Scheduling and Planning Berlin: Springer.
Alejandro, V. S., Ahmed, A., & Mohammed, F. B. (2020). Mathematical modeling and a hybridized bacterial foraging optimization algorithm for the flexible job-shop scheduling problem with sequencing flexibility. Journal of Manufacturing Systems, 54, 74–93.
Alhourani, F. (2013). Clustering algorithm for solving group technology problem with multiple process routings. Computers & Industrial Engineering, 66(4), 781–790.
Allahverdi, A. (2015). The third comprehensive survey on scheduling problems with setup times/costs. European Journal of Operational Research, 246(2), 345–378.
Andrade-Pineda, J. L., Canca, D., Gonzalez-R, P. L., & Calle, M. (2019). Scheduling a dual-resource flexible job shop with makespan and due date-related criteria. Annals of Operations Research, 291, 5–35.
Aydilek, A., Aydilek, H., & Allahverdi, A. (2017). Minimizing maximum tardiness in assembly flow shops with setup times. International Journal of Production Research, 55(24), 7541–7565.
Benkalai, I., Rebaine, D., Gagné, C., & Baptiste, P. (2017). Improving the migrating birds optimization metaheuristic for the permutation flow shop with sequence-dependent set-up times. International Journal of Production Research, 50(20), 6145–6157.
Bitar, A., Dauzère-Pérès, S., Yugma, C., & Roussel, R. (2016). A memetic algorithm to solve an unrelated parallel machine scheduling problem with auxiliary resources in semiconductor manufacturing. Journal of Scheduling, 19(4), 367–376.
Brandimarte, P. (1993). Routing and scheduling in a flexible job shop by tabu search. Annals of Operations Research, 41(3), 157–183.
Choobineh, F. (1988). A framework for the design of cellular manufacturing systems. International Journal of Production Research, 26(7), 1161–1172.
Ciavotta, M., Minella, G., & Ruiz, R. (2013). Multi-objective sequence dependent setup times permutation flowshop: A new algorithm and a comprehensive study. European Journal of Operational Research, 227(2), 301–313.
Costa, A., Fernandez-Viagas, V., & Framinan, J. M. (2020). Solving the hybrid flow shop scheduling problem with limited human resource constraint. Computers & Industrial Engineering, 146, 1–22.
Deb, K., Pratap, A., Agarwal, S., & Meyarivan, T. (2002). A fast elitist non-dominated sorting genetic algorithm for multi-objective optimization: NSGA-II. IEEE Transactions on Evolutionary Computation, 6(2), 182–197.
Erromdhani, R., Eddaly, M., & Rebai, A. (2012). Hierarchical production planning with flexibility in agroalimentary environment: A case study. Journal of Intelligent Manufacturing, 23(3), 811–819.
Gao, L., & Pan, Q. K. (2016). A shuffled multi-swarm micro-migrating birds optimizer for a multi-resource-constrained flexible job shop scheduling problem. Information Sciences, 372, 655–676.
Gong, G., Deng, Q., Gong, X., Liu, W., & Ren, Q. (2018a). A new double flexible job-shop scheduling problem integrating processing time, green production, and human factor indicators. Journal of Cleaner Production, 174(10), 560–576.
Gong, D., Han, Y., & Sun, J. (2018b). A novel hybrid multi-objective artificial bee colony algorithm for blocking lot-streaming flow shop scheduling problems. Knowledge-Based Systems, 148, 115–130.
Goyal, K. K., Jain, P. K., & Jain, M. (2013). A comprehensive approach to operation sequence similarity based part family formation in the reconfigurable manufacturing system. International Journal of Production Research, 51(6), 1762–1776.
Heger, J., Jürgen, B., Hildebrandt, T., & Scholz-Reiter, B. (2016). Dynamic adjustment of dispatching rule parameters in flow shops with sequence-dependent set-up times. International Journal of Production Research, 54(22), 6812–6824.
Ho, Y., Lee, C., & Li, C. (1993). Two sequence-pattern matching-based flow analysis methods for multi-flowlines layout design. International Journal of Production Research, 31(7), 1557–1578.
Irani, S. A., & Huang, H. (2000). Custom design of facility layouts for multiproduct facilities using layout modules. IEEE Transactions on Robotics and Automation, 16(3), 259–267.
Li, J. Y., Huang, Y., & Niu, X. W. (2016). A branch population genetic algorithm for dual-resource constrained job shop scheduling problem. Computers & Industrial Engineering, 102, 113–131.
Li, Z. C., Qian, B., & Hua, R. (2019). An elitist nondominated sorting hybrid algorithm for multi-objective flexible job-shop scheduling problem with sequence-dependent setups. Knowledge-Based Systems, 173, 83–112.
Lu, C., Gao, L., Li, X., et al. (2017). A hybrid multi-objective grey wolf optimizer for dynamic scheduling in a real-world welding industry. Engineering Applications of Artificial Intelligence, 57(C), 61–79.
Marichelvam, M. K., Geetha, M., & Tosun, O. (2020). An improved particle swarm optimization algorithm to solve hybrid flowshop scheduling problems with the effect of human factors—a case study. Computers & Operations Research, 114, 1–9.
Mutu, S., & Eren, T. (2020). The single machine scheduling problem with setup times under an extension of the general learning and forgetting effects. Optimization Letters. https://doi.org/10.1007/s11590-020-01641-9.
Naderi, B., Zandieh, M., & Ghomi, S. M. T. F. (2009). A study on integrating sequence dependent setup time flexible flow lines and preventive maintenance scheduling. Journal of Intelligent Manufacturing, 20(6), 683–694.
Nesello, V., Subramanian, A., Battarra, M., et al. (2018). Exact solution of the single-machine scheduling problem with periodic maintenances and sequence-dependent setup times. European Journal of Operational Research, 266(2), 498–507.
Paksi, A. B. N., & Ma’ruf, A. (2016). Flexible job-shop scheduling with dual-resource constraints to minimize tardiness using genetic algorithm. Materials Science and Engineering, 114(1), 1–9.
Sujoy, B., Sri, K. K., & Manoj, K. T. (2019). An efficient recommendation generation using relevant Jaccard similarity. Information Sciences, 483, 53–64.
Wang, U. (2005). Top-level design of integrated manufacturing system for capital spaceflight machinery company. Aerospace Manufacturing Technology, 10(5), 8–12.
Wu, X. L., & Sun, Y. (2018). A green scheduling algorithm for flexible job shop with energy-saving measures. Journal of Cleaner Production, 172, 3249–3264.
Wu, X. L., & Wu, S. (2017). An elitist quantum-inspired evolutionary algorithm for the flexible job-shop scheduling problem. Journal of Intelligent Manufacturing, 28(6), 1441–1457.
Wu, X. L., Xiao, X., & Zhao, N. (2020). Flexible job shop dual resource scheduling problem considering loading and unloading. Control and Decision, 35(10), 2475–2485.
Xie, J., Gao, L., & Peng, K. K. (2019). Review on flexible job shop scheduling. The Institution of Engineering and Technology Collaborative Intelligent Manufacturing, 3(1), 67–77.
Yin, Y., & Yasuda, K. (2006). Similarity coefficient methods applied to the cell formation problem: A taxonomy and review. International Journal of Production Economics, 101(2), 329–352.
Yuan, S., Li, T., & Wang, B. (2020). A discrete differential evolution algorithm for flow shop group scheduling problem with sequence-dependent setup and transportation times. Journal of Intelligent Manufacturing, 3, 1–13.
Zhang, J., Wang, W., & Xu, X. (2017). A hybrid discrete particle swarm optimization for dual-resource constrained job shop scheduling with resource flexibility. Journal of Intelligent Manufacturing, 28(8), 1961–1972.
Zheng, X., & Wang, L. (2016). A knowledge-guided fruit fly optimization algorithm for dual resource constrained flexible job-shop scheduling problem. International Journal of Production Research, 18(1), 1–13.
Zitzler, E., & Thiele, L. (1999). Multi-objective evolutionary algorithms: A comparative case study and the strength pareto approach. IEEE Transactions on Evolutionary Computation, 3(4), 257–271.
Acknowledgements
This work was supported by the National Natural Science Foundation of China under Grant (51305024).
Author information
Authors and Affiliations
Corresponding author
Additional information
Publisher's Note
Springer Nature remains neutral with regard to jurisdictional claims in published maps and institutional affiliations.
The original online version of this article was revised: Tables 5 and 7 have been corrected. Figures 10, 13, 14 and 17 have been corrected.
Rights and permissions
Open Access This article is licensed under a Creative Commons Attribution 4.0 International License, which permits use, sharing, adaptation, distribution and reproduction in any medium or format, as long as you give appropriate credit to the original author(s) and the source, provide a link to the Creative Commons licence, and indicate if changes were made. The images or other third party material in this article are included in the article's Creative Commons licence, unless indicated otherwise in a credit line to the material. If material is not included in the article's Creative Commons licence and your intended use is not permitted by statutory regulation or exceeds the permitted use, you will need to obtain permission directly from the copyright holder. To view a copy of this licence, visit http://creativecommons.org/licenses/by/4.0/.
About this article

Cite this article
Wu, X., Peng, J., Xiao, X. et al. An effective approach for the dual-resource flexible job shop scheduling problem considering loading and unloading. J Intell Manuf 32, 707–728 (2021). https://doi.org/10.1007/s10845-020-01697-5
Received:
Accepted:
Published:
Issue Date:
DOI: https://doi.org/10.1007/s10845-020-01697-5