


Abstract
Bone disease is common after gastrectomy, resulting in decreased bone mass and an increased risk of fracture. No proven therapy is currently available.
Serum markers of calcium metabolism in 98 patients after partial or total gastrectomy were compared with those in 30 age- and sex-matched healthy controls. Patients with disorders of calcium metabolism were investigated by conventional radiography and single-energy computed tomography of the spine. Forty patients participated in a 1-year follow-up study to investigate the effects of vitamin D and calcium supplementation on calcium metabolism and bone mineral density.
Altered serum markers of calcium and phosphate metabolism were observed in 77 (79 per cent) of 98 patients. Sixty (79 per cent) of these had vertebral alterations. Vertebral fractures were detected in 22 patients, grade I vertebral deformities in 50 patients, grade II deformities in 22 patients and osteopenia (Z-score less than − 1) in 30 patients. Calcium and vitamin D supplementation resulted in an increase in 25-hydroxy-vitamin D (P < 0·001), 1,25-dihydroxy-vitamin D (P = 0·048) and osteocalcin (P = 0·045), whereas levels of parathyroid hormone were decreased (P = 0·007). Bone mineral density did not change over time.
Disturbances of calcium and bone metabolism are common after gastrectomy. Calcium and vitamin D supplementation normalized levels of markers of calcium metabolism and might have prevented age-related bone mass loss, although it did not increase bone mineral density after 1 year.
Introduction
Bone disease after gastrectomy, including osteomalacia, osteoporosis or a combination of both, may occur in excess of that associated with normal ageing1. Affected patients are at risk of fractures of both limbs and spinal column2–4. Vertebral fractures in particular decrease quality of life and are expensive to treat5.
After gastrectomy, intestinal calcium and vitamin D absorption is reduced6,7. In animal models and clinical studies, decreased serum levels of calcium and 25-hydroxy-vitamin D have been noted after total gastrectomy, with increased concentrations of parathyroid hormone (PTH) and 1,25-dihydroxy-vitamin D2,8, both of which increase bone resorption. Calcium is mobilized from the bone, eventually decreasing bone mineral density (BMD)8. Vertebral fractures and/or osteopenia have been noted in 55 per cent of patients 5–20 years after gastrectomy2.
The present study investigated the prevalence of changes in calcium and bone metabolism and vertebral alterations after gastrectomy. The effects of calcium and vitamin D supplementation on calcium metabolism and BMD were assessed.
Patients and methods
Serum markers of calcium metabolism were investigated in 98 patients who had undergone partial or total gastrectomy at least 5 years earlier and compared with those in 30 age- and sex-matched healthy controls (Table 1). Underlying diseases are summarized in Table 2. All patients completed a structured interview with questions regarding quality of life, stool frequency and consistency, weight changes, daily food intake, signs of dumping, bone pain or fractures, and prescription drugs known to interfere with bone metabolism. All patients underwent physical examination. Body mass index (BMI) and nutritional status were recorded.
Characteristics of patients and controls
| Billroth I (n = 35) | Billroth II (n = 34) | Total gastrectomy (n = 29) | All gastrectomies (n = 98) | Controls (n = 30) | |
|---|---|---|---|---|---|
| Age (years) | 62(1) | 62(2) | 60(2) | 62(2) | 61(2) |
| Time after operation (years) | 14(1) | 13(2) | 8(1) | 12(1) | — |
| Sex ratio (M : F) | 2·5 : 1 | 2·4 : 1 | 0·9 : 1 | 1·8 : 1 | 1·3 : 1 |
Values are mean(s.e.m.).
Underlying diseases in 98 patients
| Billroth I (n = 35) | Billroth II (n = 34) | Total gastrectomy (n = 29) | |
|---|---|---|---|
| Duodenal ulcer | 14 | 12 | 0 |
| Gastric ulcer | 19 | 10 | 0 |
| Non-Hodgkin's lymphoma | 0 | 1 | 1 |
| Acute gastrointestinal bleeding | 1 | 0 | 1 |
| Carcinoma | 1 | 11 | 27 |
| Billroth I (n = 35) | Billroth II (n = 34) | Total gastrectomy (n = 29) | |
|---|---|---|---|
| Duodenal ulcer | 14 | 12 | 0 |
| Gastric ulcer | 19 | 10 | 0 |
| Non-Hodgkin's lymphoma | 0 | 1 | 1 |
| Acute gastrointestinal bleeding | 1 | 0 | 1 |
| Carcinoma | 1 | 11 | 27 |
Seventy-six patients with altered serum markers of calcium metabolism underwent conventional radiography of the spine and single-energy computed tomography (CT) for signs of postgastrectomy bone disease. There were 26 women of mean(s.e.m.) age 64(2) years and 50 men aged 60(1) years. Forty of these patients agreed to participate in a clinical trial investigating the effects of calcium and vitamin D supplementation. Serum variables of calcium metabolism were then measured at 6 and 12 months. BMD was reassessed by CT at 12 months. The 22 patients who showed no changes in calcium metabolism were not studied further. These patients did not differ from the study population with respect to the extent of stomach resection or duration of follow-up.
Six patients who had Billroth I resections (two women and four men), 14 patients who had Billroth II resections (seven women and seven men) and 20 patients who had total gastrectomy (ten women and ten men) participated in the supplementation trial. Their mean(s.e.m.) age was 62(2) years and the interval since operation was 9·5(1·1) years.
Patients received an intramuscular injection of 100 000 units 25-hydroxy-vitamin D (D3 Vicotrat®; Heyl, Berlin, Germany) initially, followed by 50 000 units every 3 months. Each patient was also advised to take three doses of 500 units vitamin D (Vigantoletten®; Merck, Darmstadt, Germany) orally every day and calcium 1000 mg twice daily. Patients were encouraged to eat fish at least once a week and milk products on a daily basis.
Serum levels of the following variables were measured initially and at 6 and 12 months, as described previously2: complete blood count and serum levels of calcium, phosphate, total protein, albumin, 25-hydroxy-vitamin D, 1,25-dihydroxy-vitamin D, PTH, osteocalcin, alkaline phosphatase and bone-specific alkaline phosphatase.
Anteroposterior and lateral radiographs of the thoracic and lumbar spine (fourth thoracic vertebra to fifth lumbar vertebra) were obtained with a source to film distance of 110 cm and evaluated by a single radiologist. Anterior, central and posterior vertebral heights were measured to the nearest millimetre and height ratios were used to characterize three types of vertebral deformity2: anterior wedge, concavity (or endplate) and compression (or crush) deformity. For each ratio, the quantity (1—ratio) is equivalent to the percentage deficit characterizing the vertebral deformity. The minimum cut-off for defining a deformity was three standard deviations below the expected mean. Deformities were further classified by severity as grade 1 (more than three but four or less standard deviations below the mean) or grade 2 (more than four standard deviations below the mean). Reference vertebral height ratios were obtained from a comparable central European population in Graz, Austria9.
Trabecular, cortical and total BMDs of lumbar vertebra 1–3 were measured by single-energy CT osteodensitometry (Somatom Plus VD 30®; Siemens, Erlangen, Germany) and set in relation to an age- and sex-matched reference population in the Somatom database10. BMD was expressed as a Z-score, which describes the number of standard deviations above or below the mean of the reference population. Osteopenia was defined as a Z-score of less than − 1, and osteoporosis as a Z-score of − 2·5 or less or the detection of vertebral fractures11.
Statistical analysis
Data are presented as mean(s.e.m.). The two-tailed unpaired t test, with P values corrected for multiple tests according to Bonferroni and Holm, was used for statistical analysis. P < 0·050 was taken as statistically significant.
Results
Structured interview and nutritional status
Postoperative changes in stool consistency and frequency were reported by 17 of 69 patients after partial gastrectomy and 17 of 29 patients after total gastrectomy. Symptoms of dumping were observed in 18 patients each after partial and total gastrectomy, usually triggered by ingestion of sugar or large meals. In general, greasy or sweet meals, milk products and cheese were not well tolerated. BMI was lower after total than partial gastrectomy (23·3(0·7) versus 26·2(0·6) kg/m2; P = 0·041). Bodyweight corresponded to the 52nd percentile for a healthy control population12 after partial gastrectomy, compared with the 33rd percentile after total gastrectomy (P = 0·039).
Serum markers of calcium metabolism
Altered serum markers of calcium and phosphate metabolism were observed in 77 (79 per cent) of 98 patients. Levels of 25-hydroxy-vitamin D and calcium were decreased below the normal range in 55 (56 per cent) and two (2 per cent) patients respectively, whereas levels of other markers were increased above the normal range: phosphate in 77 patients (79 per cent), bone-specific alkaline phosphatase in 41 (42 per cent), osteocalcin in 36 (37 per cent), PTH in 23 (23 per cent), 1,25-dihydroxy-vitamin D in 20 (20 per cent) and alkaline phosphatase in 20 (20 per cent) (Table 3).
Serum markers of calcium metabolism
| Billroth I (n = 35) | Billroth II (n = 34) | Total gastrectomy (n = 29) | All gastrectomies (n = 98) | Controls (n = 30) | P* | |
|---|---|---|---|---|---|---|
| Calcium | 2·41(0·02) | 2·41(0·02) | 2·33(0·03) | 2·39(0·02) | 2·40(0·02) | 0·801 |
| Phosphate | 1·08(0·03) | 1·04(0·03) | 1·05(0·02) | 1·05(0·02) | 1·17(0·01) | 0·085 |
| 25-(OH)-vitamin D | 49·7(5·7) | 33·4(3·8) | 28·9(4·6) | 37·9(2·9) | 39·2(2·5) | 1·000 |
| 1,25-(OH)2-vitamin D | 121(7) | 120(7) | 143(6) | 127(4) | 110(7) | 0·136 |
| PTH | 5·0(1·1) | 5·0(0·5) | 6·5(1·0) | 5·5(0·5) | 3·6(0·2) | 0·006 |
| AP | 137(9) | 143(7) | 161(10) | 146(5) | 117(7) | 0·005 |
| Bone-specific AP | 17·2(1·4) | 16·8(1·7) | 26·0(2·1) | 19·5(1·1) | 14·1(1·5) | 0·030 |
| Osteocalcin | 3·5(0·4) | 4·1(0·4) | 4·5(0·6) | 3·9(0·2) | 3·6(0·3) | 0·897 |
Values are mean(s.e.m). 25-(OH)-vitamin D, 25-hydroxy-vitamin D; 1,25-(OH)2-vitamin D, 1,25-dihydroxy-vitamin D; PTH, parathyroid hormone; AP, alkaline phosphatase.
Two-tailed unpaired t test with Bonferroni–Holm correction.
The largest changes were seen after total gastrectomy (Table 3). The serum level of PTH increased and that of serum phosphate decreased in all three gastrectomy groups, indicating a mechanism independent of the extent of gastric resection or the reconstruction method (Table 3). No differences in markers of calcium metabolism could be detected between groups of patients stratified by follow-up time (more or less than 10 years).
Vertebral fractures and deformities and bone density after gastrectomy
Sixty (79 per cent) of 76 patients had vertebral alterations or a reduced BMD. Fractures were detected in 22 patients, grade I vertebral deformities in 50 patients and grade II vertebral deformities in 22 patients. There were more severe vertebral alterations after total than partial gastrectomy, and women were more frequently affected than men (Table 4). Fifteen of 25 patients suffered vertebral alterations after Billroth I gastrectomy and a total of 42 alterations were detected, a mean of 2·8 per patient. Eighteen of 27 patients had vertebral alterations after Billroth II gastrectomy, with a mean of 4·1 per patient. Twenty of 24 patients suffered vertebral alterations after total gastrectomy, with a mean of 4·8 per patient.
Conventional radiography of the spine in 76 patients
| Vertebral fractures | Vertebral grade I deformities | Vertebral grade II deformities | |
|---|---|---|---|
| All gastrectomies | 22 of 76 | 50 of 76 | 22 of 76 |
| Billroth I | 7 of 25 | 13 of 25 | 3 of 25 |
| Billroth II | 9 of 27 | 17 of 27 | 6 of 27 |
| Total gastrectomy | 6 of 24 | 20 of 24 | 13 of 24 |
| Sex | |||
| Women | 10 of 26 | 19 of 26 | 8 of 26 |
| Men | 12 of 50 | 31 of 50 | 14 of 50 |
Thirty (39 per cent) of 76 patients had osteopenia of the lumbar spine (Z-score less than − 1) and one had osteoporosis (Z-score less than − 2·5). BMD was not significantly different between the three gastrectomy groups, but women were more often affected by osteoporosis than men (Table 5).
Osteodensitometry of the lumbar spine in 76 patients
| BMD (mg hydroxylapatite per ml) | Z-score | Osteopenia | Osteoporosis | |||
|---|---|---|---|---|---|---|
| Trabecular | Cortical | Total | ||||
| All gastrectomies | 86(3) | 217(4) | 304(6) | −0·8(0·2) | 19 of 76 | 22 of 76 |
| Billroth I | 87(5) | 218(8) | 305(12) | −0·6(0·2) | 7 of 25 | 7 of 25 |
| Billroth II | 83(4) | 211(6) | 294(8) | −0·9(0·2) | 6 of 27 | 9 of 27 |
| Total gastrectomy | 89(5) | 224(9) | 313(12) | −0·8(0·2) | 6 of 24 | 6 of 24 |
| Sex | ||||||
| Women | 80(6) | 216(9) | 296(14) | −0·8(0·2) | 6 of 26 | 10 of 26 |
| Men | 89(3) | 218(5) | 307(6) | −0·7(0·1) | 13 of 50 | 12 of 50 |
Values are mean(s.e.m.). Osteopenia (Z-score <−1) was detected in 30 patients (11 women and 19 men), but 11 of these had vertebral fractures and were classified as osteoporotic (Z-score ≤−2·5 or vertebral fractures). BMD, bone mineral density.
Effects of calcium and vitamin D supplementation
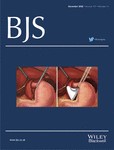
Calcium and vitamin D supplementation increased mean serum levels of 25-hydroxy-vitamin D and 1,25-dihydroxy-vitamin D, and decreased the level of PTH (Figs 1 and 2). The osteocalcin level was also increased by 12 months after supplementation (7·1(0·9) versus 4·0(0·3) ng/ml before treatment; P = 0·045). Levels of other markers did not change with time, nor did the BMD of the lumbar spine (284(9) versus 283(9) mg hydroxylapatite per ml).
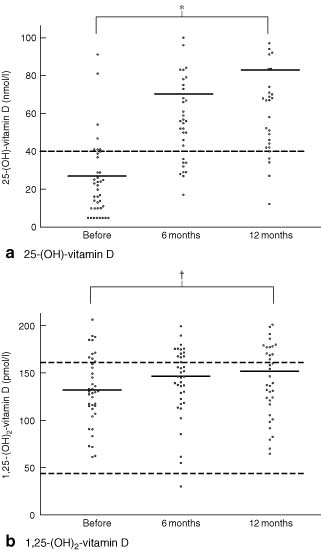
Serum levels of a 25-hydroxy-vitamin D (25-(OH)-vitamin D) and b 1,25-dihydroxy-vitamin D (1,25-(OH)2-vitamin D) for each patient before and at 6 and 12 months after calcium and vitamin D supplementation. Mean values are indicated by horizontal bars. Dotted line in a represents the lower limit of the normal range and dotted lines in b represent the normal range. *P < 0·001, †P= 0ċ048 (two-tailed t test with Bonferroni–Holm correction)
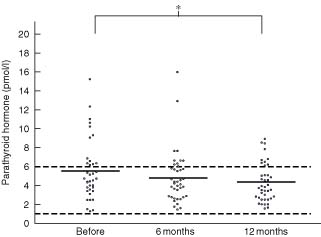
Serum levels of parathyroid hormone for each patient before and at 6 and 12 months after calcium and vitamin D supplementation. Mean values are indicated by horizontal bars and dotted lines represent the normal range. *P = 0·007 (two-tailed t test with Bonferroni–Holm correction)
Discussion
Disturbances of calcium and bone metabolism were common after both partial and total gastrectomy. Serum markers of calcium and phosphate metabolism were altered in 79 per cent of patients and vertebral alterations were identified in 79 per cent of the patients investigated.
Postgastrectomy bone disease possibly results from a latent calcium deficit, although only two patients in this series had a serum calcium level below the normal range and serum calcium levels overall after gastrectomy were no different from those in the control group.
Several factors might contribute to changes in calcium metabolism after gastrectomy including a decrease in calcium intake owing to milk intolerance, decreased release of calcium from food, impaired calcium absorption, fat malabsorption leading to the formation of calcium soaps and hypovitaminosis D, as well as rapid small intestinal transit6,7, 13–15. A combination of these factors is probably responsible for the negative calcium balance6,7 and a latent calcium deficiency after gastrectomy. Fat malabsorption with hypovitaminosis D may be a key factor in postgastrectomy bone disease. In the early stages of vitamin D hypovitaminosis, hypophosphataemia is more marked than hypocalcaemia in patients with a normal glomerular filtration rate13. Hypophosphataemia was commonly observed after gastrectomy in this study, although the absolute decrease in serum phosphate was too small to be useful in detecting early hypovitaminosis D after gastrectomy.
Hypocalcaemia leads to PTH release, which in turn increases bone resorption, decreases urinary calcium excretion, increases urinary phosphate wasting and increases the formation of 1,25-dihydroxy-vitamin D in the kidneys13. 1,25-Dihydroxy-vitamin D increases the absorption of calcium from the intestine, but is synergistic with PTH in the enhancement of bone resorption13,16,17. Previous experimental studies suggested that PTH and 1,25-dihydroxy-vitamin D might contribute to high-turnover bone metabolism after gastrectomy18,19. Similar changes were detected in the present study, suggesting that hypovitaminosis D and a subsequent increase in PTH might have triggered the changes observed.
Osteopenia was present in 11 (42 per cent) of 26 women studied, a 2·3-fold increase compared with a female Danish control population aged 60 years20. A BMD decrease of one standard deviation below the mean carries a 1·5–2·5-fold increased risk of a vertebral fracture which is further increased if a vertebral fracture is already present11, as was the case in 22 of the present patients. BMD correlates inversely with the prevalence of vertebral fracture, which increases with age21. Women who had undergone gastrectomy in this study had a 2·4–4·8-fold increased risk of vertebral fractures compared with healthy elderly women22–24. The incidence in men after gastrectomy was 5–6-fold higher than that in healthy controls3.
A significantly decreased Z-score of about −0·5 has been demonstrated in healthy women with vertebral fractures23. The mean Z-score of −0·8 observed in women after gastrectomy is almost identical to that measured by dual-energy X-ray absorptiometry (DEXA)25. In another study, the prevalence of osteopenia after gastrectomy measured by lumbar DEXA was 71 per cent in women and 18 per cent in men26, compared with 11 (42 per cent) of 26 and 19 (38 per cent) of 50 respectively in this series. In gastrectomized rats, decreased BMD has been shown to predict reduced cortical bone strength of the femur27, providing further evidence that BMD and fracture risk correlate inversely after gastrectomy.
The thoracic and lumbar spine was screened intensively for vertebral deformities, which are considered precursors of vertebral fractures. The odds ratio for a vertebral deformity increases by 1·5-fold for each decrease in BMD by one standard deviation28. The prevalence of vertebral deformities increases with age and is 14 per cent in healthy women aged 60–69 years29. Women who had undergone gastrectomy had a 5·2-fold increased risk of such deformity.
Low calcium intake has been identified as a risk factor for age-related bone loss and fractures30. Calcium alone or in combination with vitamin D has been shown to reduce the risk of fracture in elderly women31. The recommended daily calcium allowance in an ageing population has been estimated to be at least 1200–1500 mg/day, with daily intakes of up to at least 2·5 g elemental calcium considered safe32. To date, only two studies have reported on calcium and vitamin D supplementation after gastrectomy. Alhava et al.33 treated patients with calcium (2 g per day) and vitamin D (1000 units per day) for 8 months. Peripheral BMD significantly increased in men but not in women, although lack of statistical power may have explained the latter result. Tovey et al.34 used microcrystalline hydroxyapatite for calcium supplementation over 6 months, but with no significant increase in BMD.
Calcium and vitamin D supplementation normalized serum markers of calcium in most patients in the present study. Vitamin D supplementation in elderly subjects with a high prevalence of hypovitaminosis D and osteoporosis resulted in similar changes in serum levels of 25-hydroxy-vitamin D, 1,25-dihydroxy-vitamin D and PTH after 1 year35. In contrast to the present study, osteocalcin levels did not change in this population, indicating different effects on bone formation after gastrectomy.
Calcium and vitamin D supplementation possibly resulted in increased bone matrix formation in the present patients, as indicated by an increase in serum osteocalcin, but BMD did not increase after 12 months, so calcification of the newly formed osteoid might not have taken place. Nevertheless, in a study population with a mean age of 62 years, a yearly decrease of 0·6–2 per cent of the lumbar BMD would be expected20,28,30,36,37. No decrease in BMD was observed after calcium and vitamin D supplementation in the present study, indicating that this treatment might offset age-related bone loss.
There is currently no effective means of increasing BMD in patients with postgastrectomy bone disease. Theoretically, bisphosphonates, which have been shown effectively to increase BMD and decrease the vertebral fracture rate in women with osteoporosis, might be able to increase BMD by inhibiting PTH-induced osteoclast activity. Alendronate, a third-generation bisphosphonate, has been shown to prevent trabecular bone loss of the distal femur in rats38, although etidronate, a first-generation bisphosphonate, was unable to increase BMD after gastrectomy39. Fructo-oligosaccharides increased calcium absorption from the large intestine after gastrectomy in rats and completely prevented postgastrectomy bone mass loss40, but it is not known if this mechanism can be exploited in patients. In the absence of an effective means of increasing BMD, the general recommendation of vitamin D and calcium supplementation to prevent age-induced bone mass loss can be extended to patients who have undergone gastrectomy. It was safe and normalized altered serum markers of calcium metabolism.
