Abstract
Lithium (Li)-ion cells have shown great promise as an enabler for clean, renewable energy storage. However, a key factor hindering their mass adoption in fielded renewable energy systems has been management of their functional performance for more effective battery utilization and control over their life. Over the course of charge and discharge cycles, the cell electrode materials undergo reversible material phase changes, known as intercalation stage transitions, which tend to drift or change as the cell ages or degrades. Monitoring these in real-time during fielded use would be very beneficial for effective cell state estimation in battery management systems (BMS). Presently these are only characterizable using special long-duration laboratory tests such as slow scan cyclic voltammetry. This paper focuses on the potential of hair-thin fiber-optic (FO) sensors to monitor intercalation stage transition points. Sharp features were observed in the signals from FO sensors bonded on cells at certain SOC values in a repeatable manner across different cycles at various C rates. These were demonstrated to correlate with intercalation stage transitions. This novel capability enabled by FO sensors can be useful both as a Li-ion cell design characterization tool and for run-time monitoring by BMS.
Export citation and abstract BibTeX RIS
High-performance, long-lasting energy storage systems can significantly boost the adoption of clean energy technologies such as hybrid/electric vehicles and grid storage. Lithium-ion batteries in particular have emerged as a promising candidate in this regard. However, their mass adoption has been limited by factors such as high costs, battery lifetime, driving range and the susceptibility to unexpected failure. A better understanding and real-time monitoring of cell state with accurate, noninvasive sensors is essential for effective control and management of cell charge and discharge by BMS.1–3
The functional principle of Li-ion batteries is based on lithium intercalation. The insertion/release of lithium ions into/from the electrode active materials is associated with structural changes of the electrode active materials and consequently with volume change. For most Li-ion chemistries, the cell volume change is predominantly caused by the anode material. Thus, the battery expands during charge and contracts during discharge.4–9 Over the course of charge and discharge cycles, the anode and cathode materials typically go through phase changes, known as intercalation stage transitions.10 The state-of-charge (SOC) points at which these stage transitions occur tend to change with cell aging.11 Monitoring these in real-time during fielded use would be very beneficial for effective for effective cell state estimation in fielded BMS.
Prevalent BMS relies on monitoring external performance parameters such as voltage, current, and temperature to estimate SOC, state-of-health (SOH), state-of-power (SOP) and to protect the batteries. SOX (a generic term referring to SOC/SOH/SOP) estimation is in general not possible with sufficiently high accuracy using these weakly informative external parameters. Conventional methods ensuring safe battery operation with the required range and available power involve expensive overdesign of the battery and tend to result in inefficient use of available battery capacity. More informative embedded sensors are highly desirable, particularly for cell state monitoring, which could provide accurate SOC estimates and early indications of incipient problems, enabling improved SOH estimates for BMS. Intercalation stage transitions can only be monitored in the cell open circuit voltage signals, usually obtained over controlled slow discharge cycles that can take 10 hours or longer or through slow scan cyclic voltammetry.12
Fiber optic sensors are lightweight and thin, immune to electrostatic discharge, electromagnetic interference, can be protected with suitable coatings to withstand harsh environments, and can measure multiple parameters with high sensitivity, such as strain, temperature, pressure, and chemical composition in multiplexed configurations. All of these characteristics make them very attractive candidates for embedding as sensors in batteries.
Our team is exploring the potential of fiber optic (FO) sensors to identify informative cell parameters for BMS application. Since FO sensors have been demonstrated robustness to various harsh environment conditions,13,14 they also offer the possibility of embedding within cells for direct internal cell state monitoring. Some initial results from those efforts by our team have been published in a separate paper.15
As an initial step toward evaluating the potential of embedded FO sensors for effective cell state monitoring, within this work, a particular class of FO sensors, fiber Bragg grating (FBG) sensors were investigated. These sensors are well known to be sensitive to strain and temperature. In this study, FBG sensors were attached externally to lithium-ion pouch cells. These have shown promising results to detect intercalation stage transition points reliably across different charge/discharge rates. This paper focuses on the potential of FO sensors to monitor intercalation stage transition points, which can be useful both as a design characterization tool and for run-time cell state monitoring by the BMS.
Experimental
Initial experiments explored the use of externally bonded FBG sensors to determine cell strain change during charging and discharging. A pair of FBG sensors were used to separate strain and temperature. They were inscribed into polyamide-coated silica fibers. The core diameter and cladding diameter were 8 μm and 125 μm, respectively. The diameter of the coated fiber was approximately 155 μm. The Bragg wavelengths of the FBG sensors were 1555 nm and 1560 nm, respectively. As the reflected Bragg wavelength is sensitive to applied strain from both mechanical loads and temperature changes, the reference sensor method as described in Rao et al.16 is used to eliminate temperature impacts. For this purpose, the measured wavelength shift of the reference FBG sensor was subtracted from the total wavelength shift of the FBG sensor sensitive to strain so that temperature variations were compensated.
Figure 1a illustrates the test setup that was chosen for these cell-level studies. The cell was clamped between two acrylic glass sheets and 2 cm-thick insulative Styrofoam sheets to simulate the module pressure and thermal environment. In addition to the FBG sensor signals current, voltage and temperature signals were monitored. The setup was arranged in an environmental chamber maintained at room temperature.
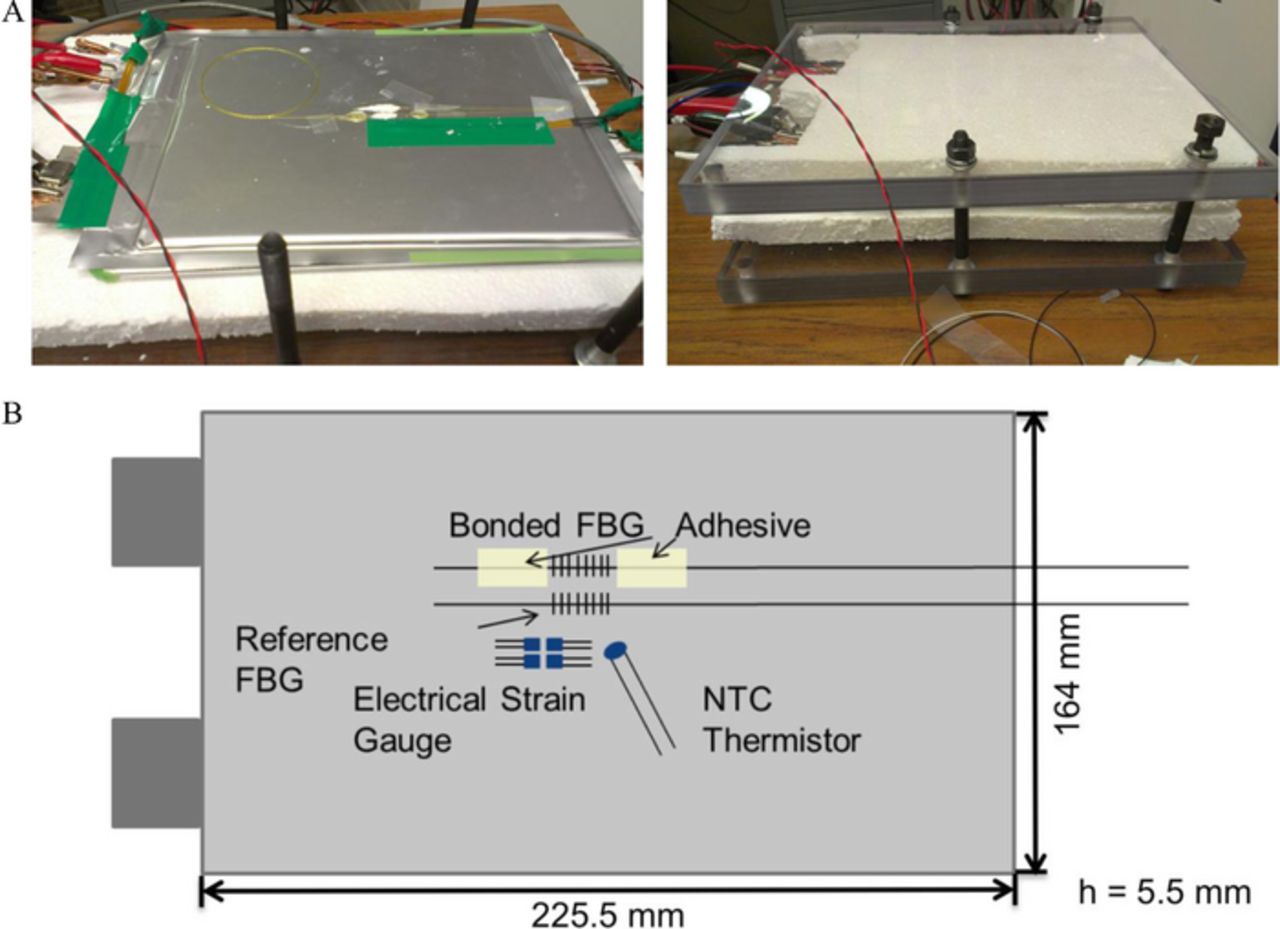
Figure 1. (A) Experimental setup for external FBG sensing experiments. The left figure shows the attached FBG sensors as well as the reference NTC thermistor. The right figure depicts the cell fixture setup. (B) Schematic of the experimental setup for monitoring strain and temperature of Li-Ion pouch cells by Fiber Bragg Grating sensors. Bonded FBG sensor is attached with an adhesive to monitor strain and temperature. Reference FBG sensor is loosely attached with heat conducting paste.
The two FBG sensors were externally attached to a Li-ion cell as described in our earlier work.17 The schematic of the setup is illustrated in Figure 1. The first FBG sensor was bonded at two points to the surface of the pouch cell with epoxy. The bonding lengths were approximately 1 cm. The second FBG sensor was loosely attached with heat conducting paste. The bonded FBG was sensitive to both strain and temperature changes. The loosely attached FBG sensor was strain independent and was used as reference sensor to compensate temperature variations and the strain due to thermal expansion of the cell.
The reflected wavelength peaks of the FBG sensors were monitored by a National Instruments (NI) PXIe-4844 optical sensor interrogator (OSI). The OSI was used to monitor the reflected wavelength peak of the FBG sensors. The OSI consists of a tunable laser which is sweeping across the wavelength range and a photo detector which measures synchronously the reflected light. Once the wavelength of the laser matches the Bragg wavelength of the FBG, the photo detector monitors a corresponding response. The OSI detects peaks exceeding the set threshold intensity and assigns the peaks automatically to FBG sensors. The accuracy of the measured peak wavelength with the OSI is 1 pm.
The LG Chem lithium ion pouch cell explored in this study had a nominal capacity of 15 Ah. The cell has a blended cathode composed of Spinel/NMC while the anode material was composed of graphite with some small fraction of hard carbon. Charge and discharge cycles were performed with a programmable battery analyzer (BST8-10A30 V). The employed standard cycle consisted of charging at a constant current of 7.5 A to a cutoff voltage of 4.15 V, charging at a constant voltage of 4.15 V to a cutoff current of 750 mA and discharging at a constant current of 7.5 A to a cutoff voltage of 3.0 V. The rest time between charge and discharge was set to 2 h. All measurements were performed at room temperature.
Results and Discussion
Standard charge and discharge cycles as specified above were performed to examine the strain and temperature response of the attached FBG sensors. Figure 2 illustrates the wavelength shift of the bonded FBG sensor, the loosely attached reference FBG sensor and the temperature compensated strain signal as well as the corresponding voltage and current signals. The reflected wavelength of both sensors was zeroed at the beginning of the charge cycle. Note that a wavelength shift of 1 pm corresponds to a strain of approximately 1 μɛ in the extracted strain signal (or a temperature change of approximately 0.1°C in the loose FBG signal). A detailed description of both the measured wavelength shift of the bonded FBG sensor and the reference FBG sensor are given in a previous paper by our team.17
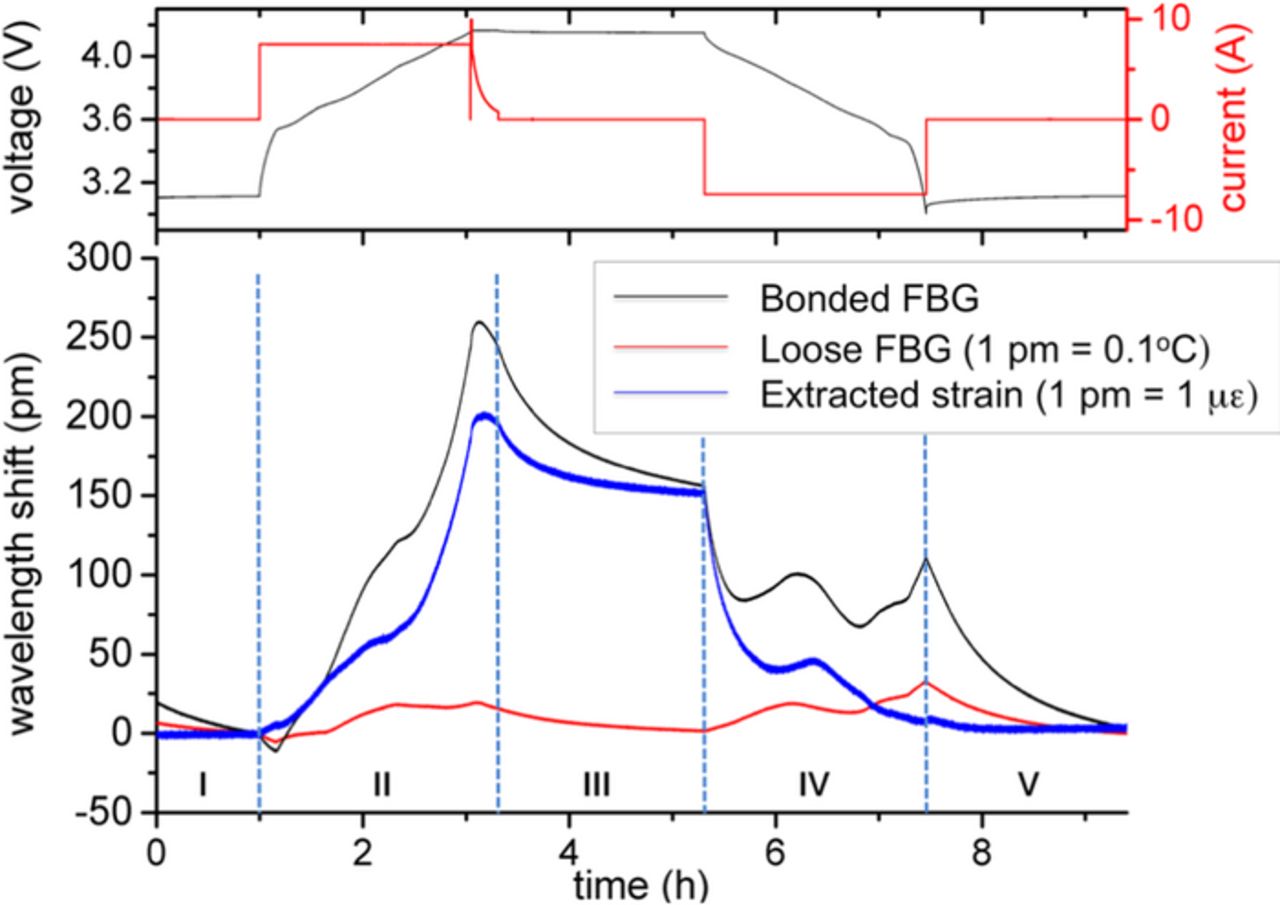
Figure 2. Bragg wavelength shift of the bonded (black) and loosely attached (red) FBG sensor as well as the temperature compensated strain signal (blue) for standard charge and discharge. The corresponding voltage and current data are illustrated in the upper plot.
In the following the temperature-compensated strain signal will be examined in more detail. In general, strain is caused by volume expansion of the lithium ion battery. This volume change is transferred into an elongation of the cell skin that causes a wavelength shift whereas the thermal expansion of the lithium ion cell is compensated by means of the reference sensor.
The strain signal is almost constant in the initial no-load phase and is constantly increasing during the following constant current charge. The strain signal exhibits an enhanced increase at the end of the constant current charge phase. After reaching its maximum in the constant voltage phase the strain starts decreasing. At the transition to the subsequent no load phase the decrease gets steeper and indicates the curve of a relaxation process. At the end of the rest period a residual wavelength shift is distinguishable. During the following discharge cycle the strain signal converges to the initial value.
The volume expansion during charge as well as the contraction during discharge is explained by lithium ion intercalation/de-intercalation and the corresponding lattice expansion and contraction of the electrode active material. In general, the active material of the anode dominates the volume change. The exact correlation between measured strain and the volume change (ΔV) of the battery cell can be estimated using some reasonable assumptions:
- (a)The measured strain is attributable to an elongation of the cell skin caused by a volume expansion.
- (b)The volume expansion is primarily due to an electrode thickness change (Δh);4 thus, as a first-order approximation, ΔV/V ≈ Δh/h
- (c)The measured cell skin strain (Δl/l, with maximum value of 180 μɛ) results from the skin perimeter change caused by the electrode thickness change; the two parameters are related by Δh ≈ (Δl/l.(l + h)). For the cell monitored, as indicated in Figure 1, l = 225.5 mm, h = 5.5 mm.
- (d)Thus, the maximum calculated strain yields a volume change of 0.76%. By considering only the anode as trigger for the volume change, and accounting for the 35% volume fraction of the anode materials in the LG Chem cell, the anode volume expansion is approximately 2.17%.
This estimated 2.17% volume expansion of the graphitic anode is comparable to the values of 3% and 4% experimentally reported respectively in18 using neutron imaging and in4 using thickness gauges. However, it is less than the 10% volume expansion of graphite reported elsewhere.19 It has been hypothesized that about half of the 10% reported volume change of graphite in19 can be ascribed to the SEI layer,4 which is not expected to cause major changes after the initial formation cycle, at least while the cell is relatively early in its life cycle. Furthermore, the presence of some proportion of hard carbon in the anode (as is the case for the LG Chem cells studied here) can contribute to a reduced volume expansion relative to a pure graphite anode.4 Hahn et al20 reported a maximum expansion of 4.2% of graphite flakes by dilatometric studies. They ascribed the reduced expansion (relative to the 10% reported in19) to the nearly random orientation of the graphite flakes in the powder electrode. Furthermore the influence of the cell skin is not known. It is reported that soft pouch skins can effectively absorb dimensional stress,4,21 but the strain transfer to the cell skin is presumably not ideal and thus may also contribute to some error in estimating anode volume expansion. Further experiments would be necessary to accurately measure and understand the anode/cell volume change.
In addition to the volume expansion during charge and contraction during discharge, several characteristic features are indicated in the temperature-compensated strain signal. These features are plateaus in the strain signal during charge and discharge as well as the relaxation phenomenon at the transition from charge to no load. The relaxation of the strain signal was examined in detail in other work by our team22 and associated to Li ion diffusion in the electrode particles. In the following, features during charge and discharge will be discussed.
Multiple standard charge and discharge cycles were performed. The corresponding strain signals as a function of SOC and depth-of-discharge (DOD) respectively are shown in Figure 3. The strain signal was zeroed at the beginning of charge cycle for each cycle separately. The illustrated charge cycles are confined to the CC phase. Both the strain signals during charge and discharge exhibit an excellent repeatability as discussed in Ref. 17. The consistent plateaus during charge and discharge indicate a correlation of the strain signal and SOC and DOD, respectively. Sharp features can be observed at certain SOC values (marked using ovals in Figure 3), in a repeatable manner across different cycles at the same C rate (C/2 in Figure 3A). The sharp features in the strain curves also occur consistently at the same SOC/DOD levels across different C rates ranging from C/5 through 1.5 C, as shown in Figure 3B. More generally, the strain curves themselves are similar across the different C rates, which raises the possibility of using these strain curves as basis for SOC estimation across different static and dynamic cycles. This is the subject of ongoing study within our team and will be elaborated on in a future paper.
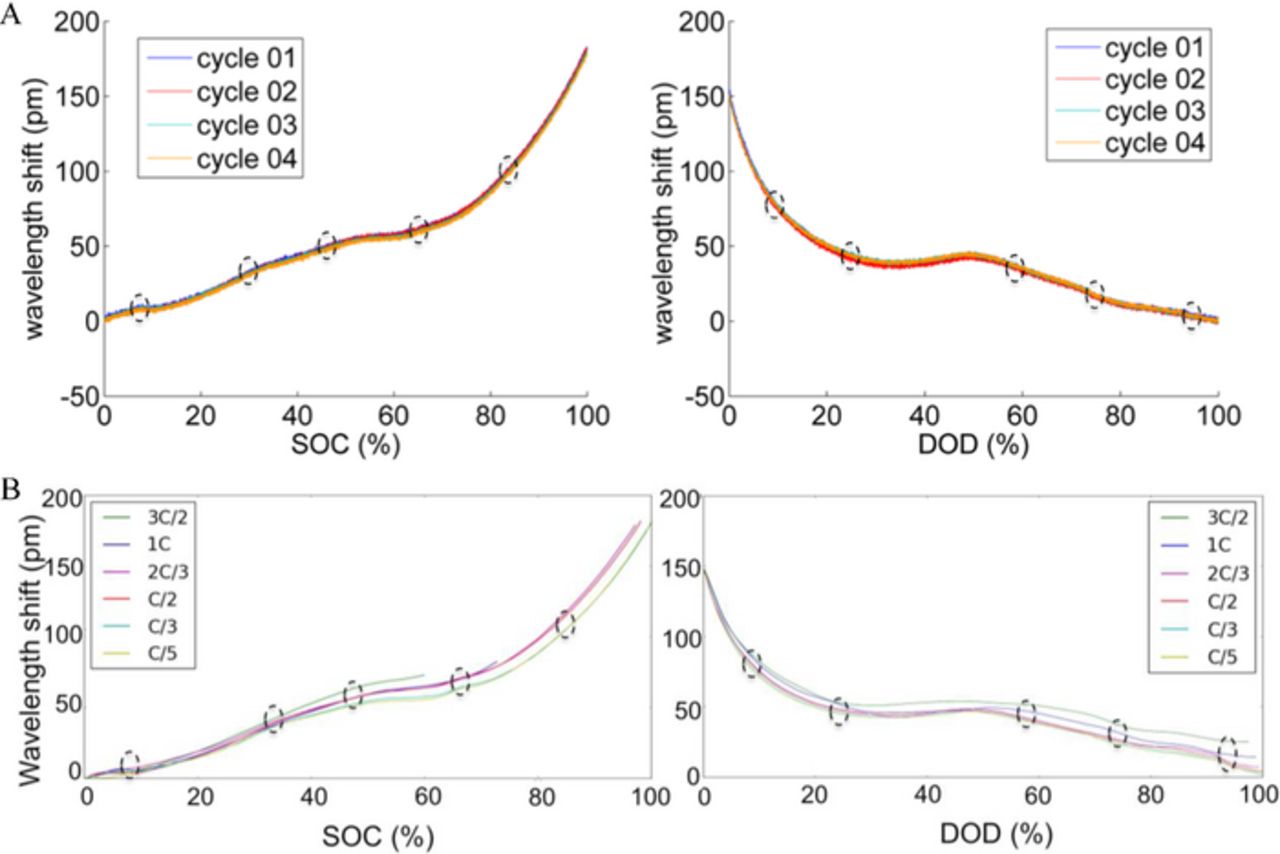
Figure 3. The FBG signals over multiple static cycles of charge (left) and discharge (right) show repeatable features for charge (left) and discharge (right), marked with dashed ovals, across (A) different cycles at the same C rate (C/2) and (B) different C rates from C/5 through 1.5 C.
The first derivative of the wavelength shifts with respect to SOC and DOD was calculated to illustrate these features. The first peak for charge and discharge is an artifact caused by the applied filter (applied to smooth the measured data). Figure 4 shows the corresponding derivatives for the standard cycles shown in Figure 3. The derivatives of the strain signal exhibit multiple peaks labeled as A to E. The peaks are monitored for charge as well as discharge cycles. During charge, peaks in the derivative of the strain signal indicate an enhanced strain increase for the corresponding SOC. During discharge, minima in the curve reveal an enhanced strain decrease for the corresponding DOD. The enhanced increase of the strain signal for high SOC is associated with an inhomogeneous Li ion distribution due to fast intercalation and slow diffusion in the electrode particles as discussed in another paper by our team.22
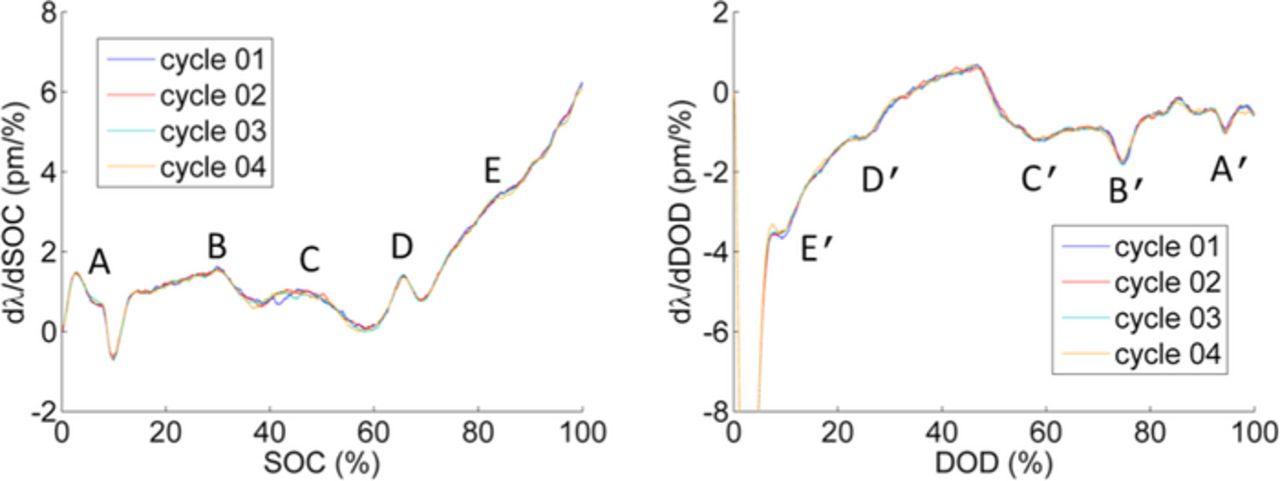
Figure 4. Derivative of wavelength shift with respect to SOC indicates SOC range with enhanced volume change (labeled as peaks).
The enhanced strain increase indicated by peaks during charge are associated with structural changes of the electrode active materials. The strain signals are compared to the measured voltage signal to analyze the relation between these features and intercalation effects. Figure 5 shows the measured voltage curve and the corresponding strain signal for a standard charge cycle. The voltage curve exhibits distinctive features such as adumbrated plateaus over charge and discharge cycles. As discussed above, plateaus are evidence for the coexistence of phases whereas steeper sections are ascribed to particular stages. However, a correlation of features in the strain signal to phases or phase transitions in the measured cell terminal voltage curve for faster charge/discharge rates typical of fielded use cases is not possible, as the observed plateaus in the cell terminal voltage curve at higher C rates are not well pronounced and occur at different SOC levels depending on the C rate. Therefore, the first derivative of the voltage with respect to SOC was calculated to identify certain stages or phases. Peaks in the calculated voltage derivatives can be ascribed to phases for the charge cycle. Figure 6 shows the first derivatives of both the measured voltage and the strain signal with respect to SOC. The calculated voltage derivative indicates several peaks at about SOC5, SOC20, SOC25, SOC50, SOC65 and SOC80 for charging. The comparison of the voltage and strain derivatives indicates a systematic shift between the observed peaks. These shifts between the peaks suggest that the peaks in the derivative of the strain signal are not associated with certain phases.
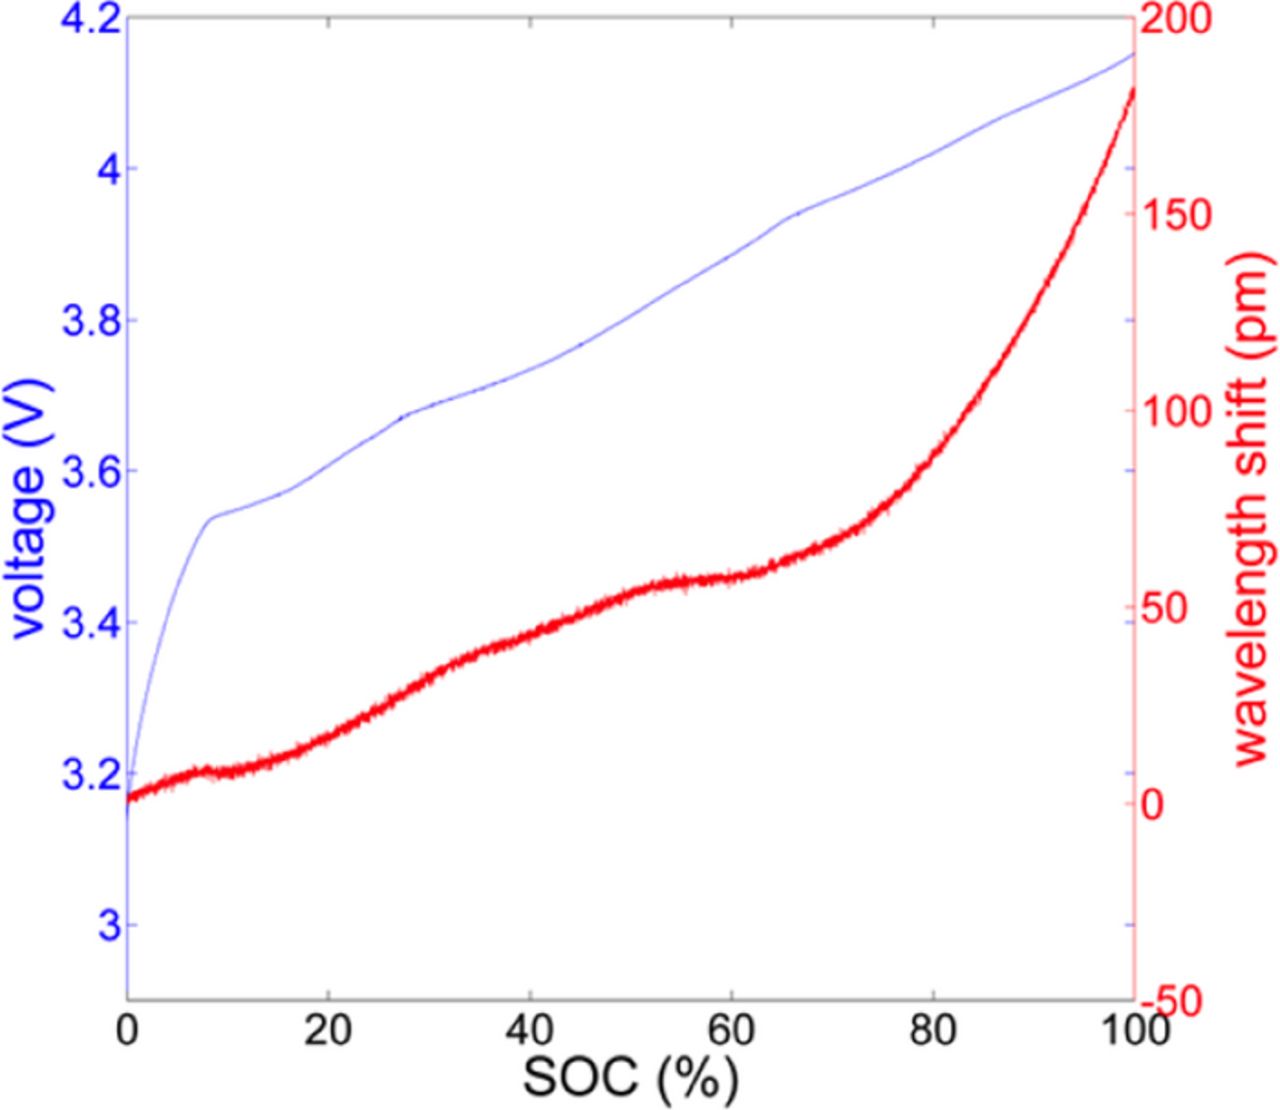
Figure 5. Comparison between cell terminal voltage and FBG recovered strain wavelength shift signals as a function of SOC over a standard charge cycle.
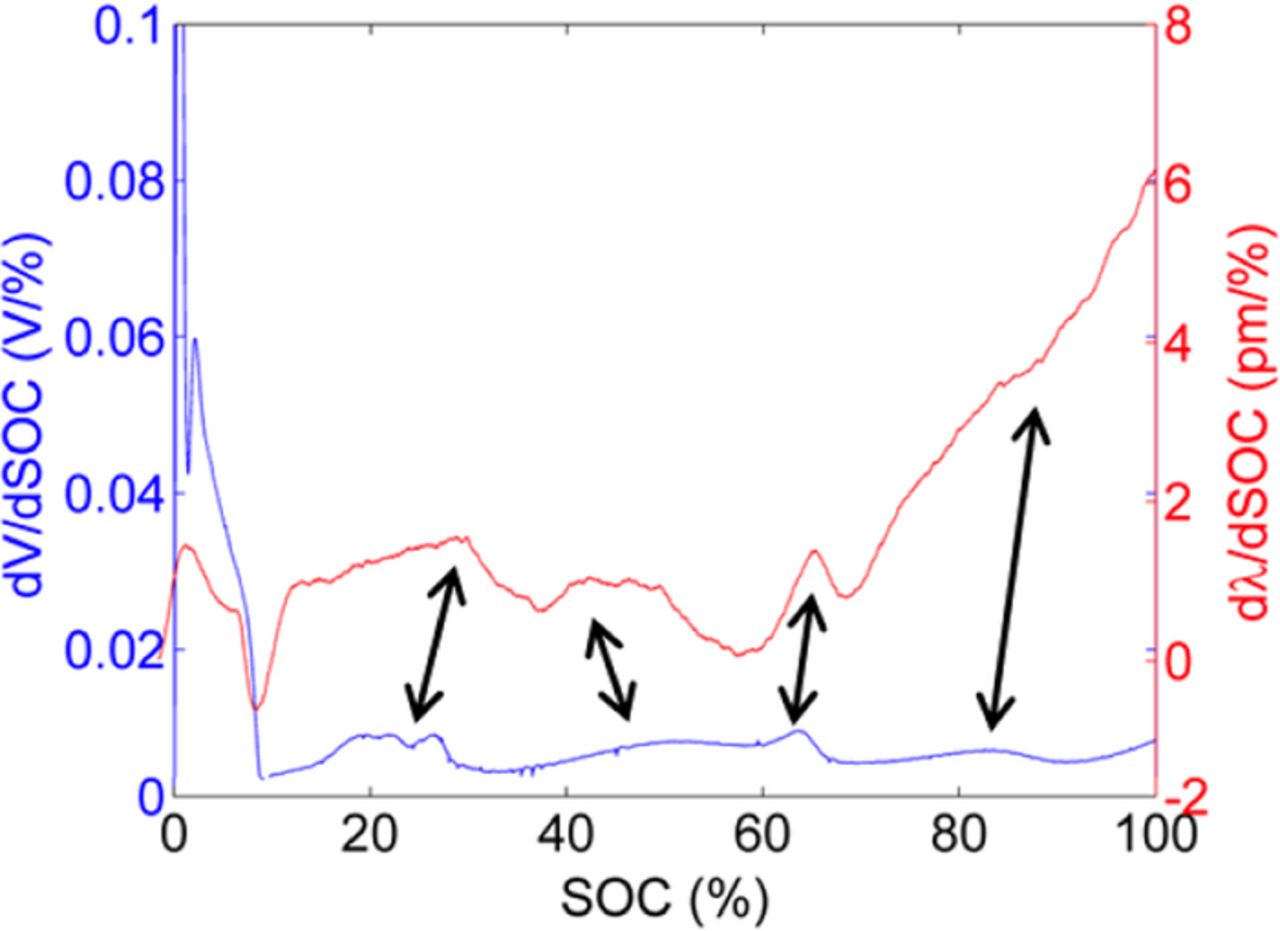
Figure 6. Comparison between first derivatives of voltage and recovered strain FBG signals as a function of SOC. The double-arrow lines indicate the correlation between the SOC levels at which peaks occur in the two derivative signals.
The correlation between phase transitions and features in the strain signal can be analyzed by comparing the derivative of fraction of intercalated/de-intercalated lithium and the derivative of the wavelength shift with respect to the voltage. The derivatives dSOC/dV and dλ/dV as a function of the voltage were calculated for a standard charge cycle as depicted in Figure 7. The derivative dSOC/dV shows peaks at voltages where phase transitions occur, as proposed by Dahn et al.23 The number and location of peaks in dSOC/dV are in agreement with slow scan cyclic voltammetry (SSCV) results for the same cell, shown in Figure 8. SSCV is a relatively established laboratory characterization method to monitor phase transitions of graphite and various transition metal oxides.24 Thus the detected peaks in dSOC/dV can be reliably attributed to phase transitions of the electrode material.
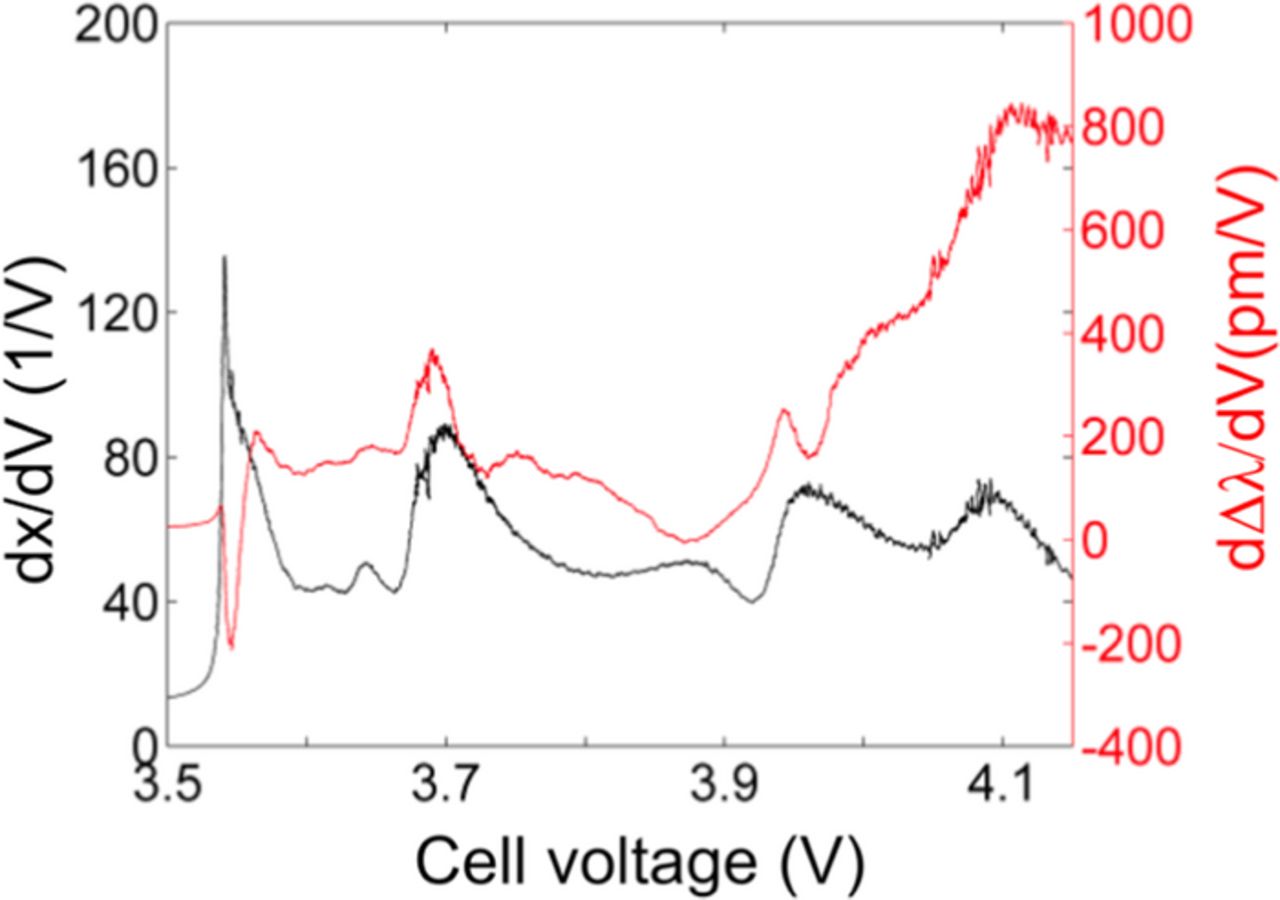
Figure 7. Derivatives dSOC/dV and dΔλ/dV as a function of the voltage calculated for a standard charge cycle.
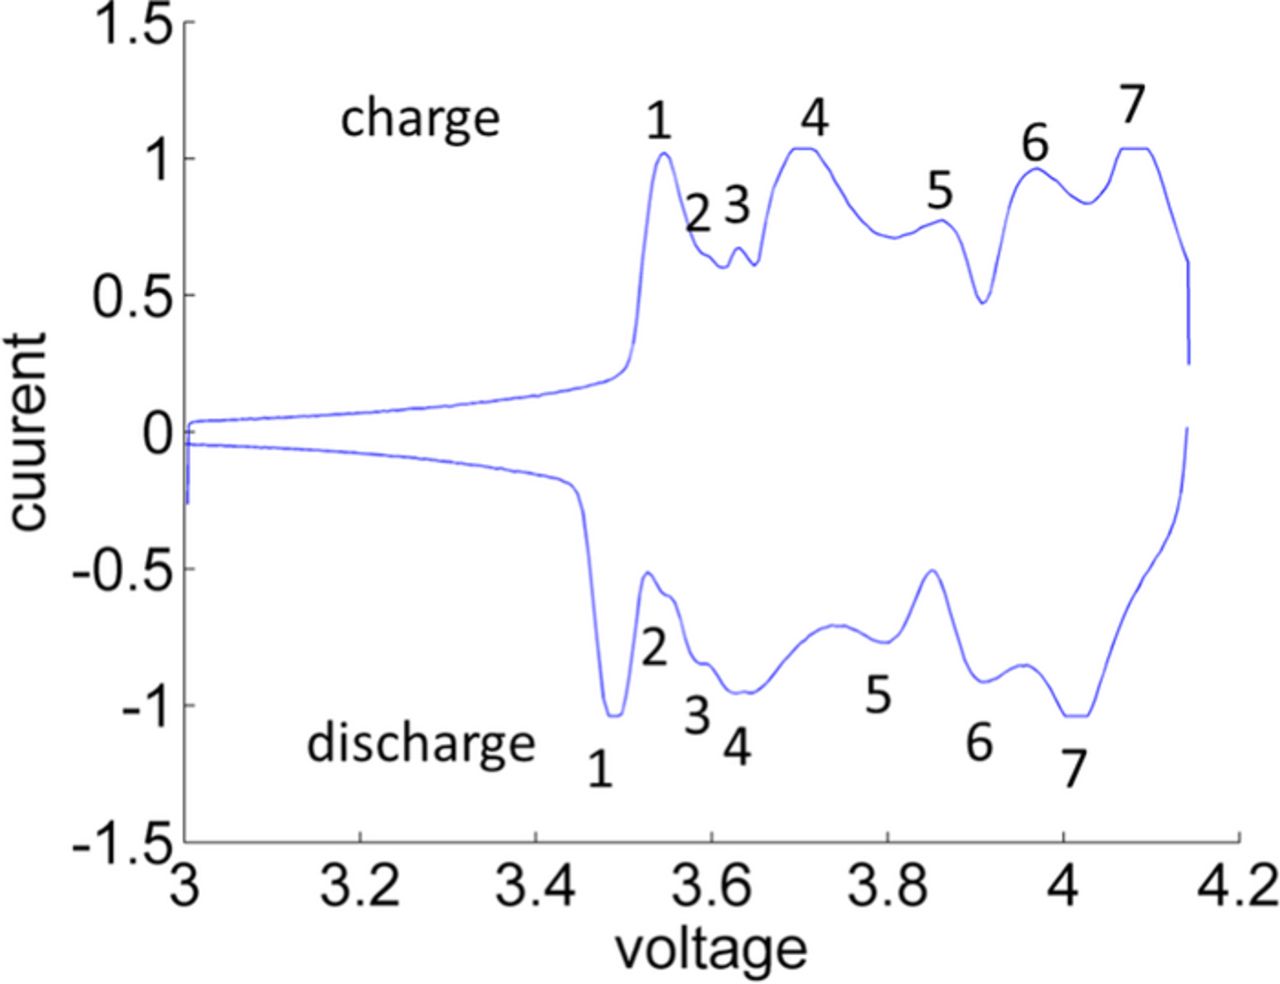
Figure 8. The slow scan cyclic voltammetry (SSCV) results for the cell exhibits seven peaks for charge and seven minima for discharge. Peaks and minima respectively are associated with phase transition regions. The applied scan rate was set to 10 μV/s. The analyzed voltage range from 3 to 4.15 V is identical to the cycle voltage range.
In total seven phase transitions can be distinguished in the derivative plots in Figure 7. This is consistent with the SSCV results in Figure 8. The appropriate voltages for the charge process are 3.54, 3.615, 3.635, 3.69, 3.87, 3.95 and 4.08 V. Peaks in dλ/dV are observed for 3.615, 3.635, 3.69 and slightly below 3.95 V whereas no peaks are monitored for the subsequent phase transitions. The peaks in the voltage range below 3.6 V for charge and above 4.0 V for discharge are artifacts caused by the applied filter which requires further optimization in the future.
However, peaks in dλ/dV represent an enhanced increase in the strain at the corresponding voltage. As discussed earlier, the monitored strain is caused by volume expansion of the electrode materials. X-ray measurements of graphite indicate an increasing average spacing d between graphene layers for coexisting stages during charge,23 which in turn results in cell volume expansion. In contrast, X-ray measurements of LiMn1/3Ni1/3Co1/3 and LiMn2O4 exhibit slightly decreasing lattices constants.25,26 The resulting contractions are minor compared to the anode volume expansion. These intercalation stage transition points are known from the literature11 to change with cell aging, as observed in elaborate laboratory characterization tests using special cells. As such, monitoring them in fielded packs using FO sensors can potentially offer a new metric for state-of-health monitoring and capacity fade estimation.
Future work will address more detailed characterization of the intercalation stage shifts using the fiber-optic sensing approach established herein over the life of the cell and the mapping of these stages to the anode or cathode material based on half-cell voltage data.
Conclusions
This paper demonstrated the potential of a particular type of fiber-optic sensors, Fiber Bragg Gratings (FBGs), as a promising solution for monitoring additional cell parameters such as strain and temperature to aid state estimation in battery management systems. Analysis of signals from FBGs externally mounted on cells yielded novel features to enable better real-time cell state estimation that were previously not possible with cell current or voltage signals during fielded use cases.
The signals showed sharp features in the strain curve for charge and discharge that were repeatable across different C rates. Sections with steep slope indicated as peaks in the corresponding derivative signals were assigned to phase transitions by correlating them to slow-discharge voltage measurements. This hypothesis was in good agreement to previous studies. These detectable intercalation stage transition points can guide cell analysis during design and characterization iterations, as well as for run-time monitoring in battery management systems to aid cell state estimation. Longer-term experiments where the intercalation stage transition points shift and other effects such as gas evolution in the pouch are monitored over the course of the cell life are presently in progress.
The present study was limited to cell-level experiments in pouch cells. The results should be extensible to packs and modules where the pouch cells are packed in cans under pressure: the fiber-optic cables being hair-thin can be accommodated within existing commercial xEV module and pack designs, as well as embedded inside the electrode stack for direct internal electrode monitoring. More recently, our team has had promising initial results toward practical deployment of this technology for fielded packs recently in ongoing module-level validation tests, building on the cell-level results presented herein. The detailed results of those ongoing validation efforts will be published in a future paper.
Acknowledgments
The information, data, or work presented herein was funded in part by the Advanced Research Projects Agency-Energy (ARPA-E), U.S. Department of Energy, under Award Number DE-AR0000274. The authors also appreciate suggestions and support on the paper revisions from Andreas Schuh and Kyle Arakaki at PARC.