

Abstract
Increased aridity and drought risks are significant global concerns. However, there are few comprehensive studies on the related risks with regard to the differences between relatively weak levels of warming, including the recent targets of the United Nations Framework Convention on Climate Change (UNFCCC) of 1.5 °C or 2 °C. The present study investigates the impacts of 1.5 °C and 2 °C warming on aridification and their non-linearity based on the relationship between available water and energy at the Earth's terrestrial surface. Large multi-model ensembles with a 4000-model-year in total are sourced from the Half a degree Additional warming, Prognosis, and Projected Impacts (HAPPI) project. Results demonstrate that 2 °C warming results in more frequent dry states in the Amazon Basin, western Europe, and southern Africa, and a limited warming to 1.5 °C will mitigate aridification and increase the frequency of extreme dry-year in these regions. In the Mediterranean region, a significant acceleration of aridification is found from the 1.5 °C to 2 °C warming projections, which indicates a need to limit the warming by 1.5 °C. A substantial portion of Asia is projected to become increasingly humid under both 1.5 °C and 2 °C warming scenarios. In some geographic regions, such as Australia, a strong nonlinear shift of aridification is found as 2 °C warming results in shift to wetter state contrast to significant increases in aridity and dry-year frequency at the weaker level of warming. The results suggest that the responses of regional precipitation to global warming cause the aridity changes, but their nonlinear behaviors along with different warming levels should be assessed carefully, in particular, to incorporate the additional 0.5 °C warming.
Export citation and abstract BibTeX RIS

Original content from this work may be used under the terms of the Creative Commons Attribution 4.0 license. Any further distribution of this work must maintain attribution to the author(s) and the title of the work, journal citation and DOI.
1. Introduction
Global warming is expected to increase the risk of droughts in many regions (Prudhomme et al 2014, Carrão et al 2017, Huang et al 2017) and cause damage to human society and the ecosystem (Peng et al 2004, Franchini et al 2015, Rose et al 2016). Changes in drought risk are projected to differ widely among regions (Greve et al 2015, Donnelly et al 2017, Huang et al 2017). Many studies have examined projected changes in drought duration, intensity, and frequency under a warmer climate, and most of their assessments have focused on the scenarios with a high level of warming (e.g. RCP8.5 or RCP4.5).
The 2015 Paris Agreement, also known as the United Nations Framework Convention on Climate Change (UNFCCC), proposed a long-term climate goal aimed at '...holding the increase in the global average temperature to well below 2 °C above pre-industrial levels and pursuing efforts to limit the temperature increase to 1.5 °C' (Unfccc 2015). However, research on the comparative impact between 1.5 and 2 °C warming is still emerging. These targets have been referred to as '...what policy makers at that time considered to be both realistically achievable and tolerable' (Knutti et al 2016). The lack of scientific background and understanding was already recognized when this target was decided, and resulted in the production of a special report by the Intergovernmental Panel on Climate Change (IPCC) in 2018 to discuss the relative impacts of 1.5 and 2 °C warming levels (IPCC 2018). Despite this report, many questions remain regarding the impacts and underlying mechanisms of these specific warming targets.
Most studies on these warming targets have been based on transient scenario-dependent projections, such as the Coupled Model Intercomparison Project Phase 5 (CMIP5), but there are challenges in evaluating the impacts induced by relatively weak levels of warming. An ensemble model means the RCP4.5 and RCP8.5 would reach 2.5 and 4.4 °C above pre-industrial levels by the end of this century, respectively. However, most members reach stable temperatures considerably higher than 1.5 or 2 °C. RCP2.6, the lowest CMIP5 scenario, results in a 1.5 °C ensemble mean increase, yet the ensemble spread is large (Collins et al 2013). Sampling a subset of the ensemble members that reach equilibrium around the target warming level is not suitable for impact assessment studies. This is because these studies require a large number of samples to provide statistically robust analyses, for example the probability distributions and drought return periods. Furthermore, time slicing and pattern scaling are not appropriate solutions because they do not carefully consider the scenario dependency and non-linearity of the climate system (Wang et al 2017, James et al 2017).
The present study investigates the change in aridity at 1.5 and 2 °C warming in terms of the hydroclimatic balance between available water and energy at Earth's surface, based upon the stabilized future climate projections provided by the Half a degree Additional warming Prognosis and Projected Impacts (HAPPI) project (Mitchell et al 2017). Several impact assessment studies have already been undertaken under this project to investigate impact on agricultural sector (Ruane et al 2018), maximum temperature extremes (Wehner et al 2018) and intensification of wet and dry swings (Madakumbura et al 2019). However, global scale estimations of surface energy and water balance under stabilized climate conditions has not been thoroughly investigated, and the hydroclimatic mechanisms of aridity changes remain unclear. Our results show where and to what extent aridification increases are expected, as well as the specific reasons for such projections, i.e. changes in precipitation and/or net radiation. Further, the analysis using the large-ensemble simulations under stabilized climate conditions potentially provides additional insights that are complementary to earlier studies based on transient scenarios (e.g. Lehner et al 2017, Park et al 2018) as processes of hydrological cycle (e.g. precipitation) do not only respond solely to temperature changes (Mitchell et al 2016).
2. Data and methods
2.1. Models and scenarios
Climate simulations used in this study are obtained from the HAPPI project, which aims to distinguish impacts between 1.5 and 2 °C warming. For this purpose, three scenarios are employed: (1) 'All-Hist' (hereafter ALL) to reproduce the present climate (2006–2015), which is 0.8 °C warmer than pre-industrial (1861–1880); (2) 'Plus 1.5' (hereafter P15) and (3) 'Plus 2.0' (hereafter P20) for future climate (2106–2115) 1.5 and 2 °C (0.7 and 1.2 °C) warmer than pre-industrial (present), respectively. The HAPPI experiments are atmosphere-only global climate simulations forced by observed sea surface temperatures (SST) for ALL, and SST anomalies from the CMIP5 ensemble are added to the observed SST for P15 and P20 experiments. Full details are described in Mitchell et al (2017). The radiative forcing conditions are taken from CMIP5 for the ALL experiments. In P15 and P20 experiments, natural radiative forcings are set to the same configuration of ALL experiment, allowing us to examine only anthropogenic changes to the climate system. The anthropogenic forcings for P15 experiments are taken from the end of the 21st century in the CMIP5 RCP2.6 scenario, which results in a mean 1.5 °C warming. For 2 °C warming (i.e. P20), RCP2.6 and RCP4.5 are combined so that the increase in global mean surface temperature is exactly half a degree higher than the RCP2.6 scenario (Mitchell et al 2017).
Furthermore, to avoid unnecessary uncertainty, land-use and land-cover forcings have been inherited from each model's CMIP5 configurations as well. The representations of the interactions among the atmosphere, ocean, land, and sea ice are likely consistent with their fully coupled experiments in CMIP5. Therefore, the HAPPI simulations would be suitable for assessing the shifts of the mean hydroclimatic states. However, it should be noted that the short-term (e.g. sub-seasonal) hydroclimatic variability is strongly correlated with land cover dynamics and associated land-atmosphere interactions which is lacking in the simulations, and land use has a significant role on characteristics of regional climate extremes in low-emission scenarios (Hirsch et al 2018).
To avoid a skewed sampling error and to assure statistical robustness of changes among scenarios, only models providing ensembles greater than or equal to 100 are chosen: CanAM4 (Salzen et al 2013), ECHAM6.3-LR (Stevens et al 2013) (hereinafter ECHAM6), MIROC5 (Watanabe et al 2010) and NorESM1-HAPPI (Iversen et al 2012, Bentsen et al 2013, Kirkevåg et al 2013) (hereinafter NorESM1) (see table 1 for details). In addition, 100 ensemble members (10-year per ensemble) are selected from each model, which results in 1000 model-years per scenario per model. This allows us to detect statistically significant differences between ALL, P15, and P20 from the noise of the analysis such as internal model and climate variabilities.
Table 1. Models whose experiment results are used in this paper.
| Model Names | Abbreviations | Spatial Resolutions (lon × lat) | References |
|---|---|---|---|
| CanAM4 | CanAM4 | 128 × 64 | Salzen et al 2013 |
| ECHAM6.3-LR | ECHAM6 | 192 × 96 | Stevens et al 2013 |
| MIROC5 | MIROC5 | 256 × 128 | Watanabe et al 2010 |
| NorESM1-HAPPI | NorESM1 | 288 × 192 | Bentsen et al 2013, Kirkevåg et al 2013, Iversen et al 2012 |
2.2. Hydroclimatic regime and Budyko framework
In this study, hydrological dryness is determined by the balance between available energy and water at the surface. The Budyko framework has been widely used as a joint analysis using hydroclimatological variables (i.e. Koster et al 2006, Maeda et al 2017), and its dryness index is defined as equation (1) (Budyko 1974):

where,  is the Budyko dryness index,
  is net radiation at the surface,
  is the latent heat coefficient, and
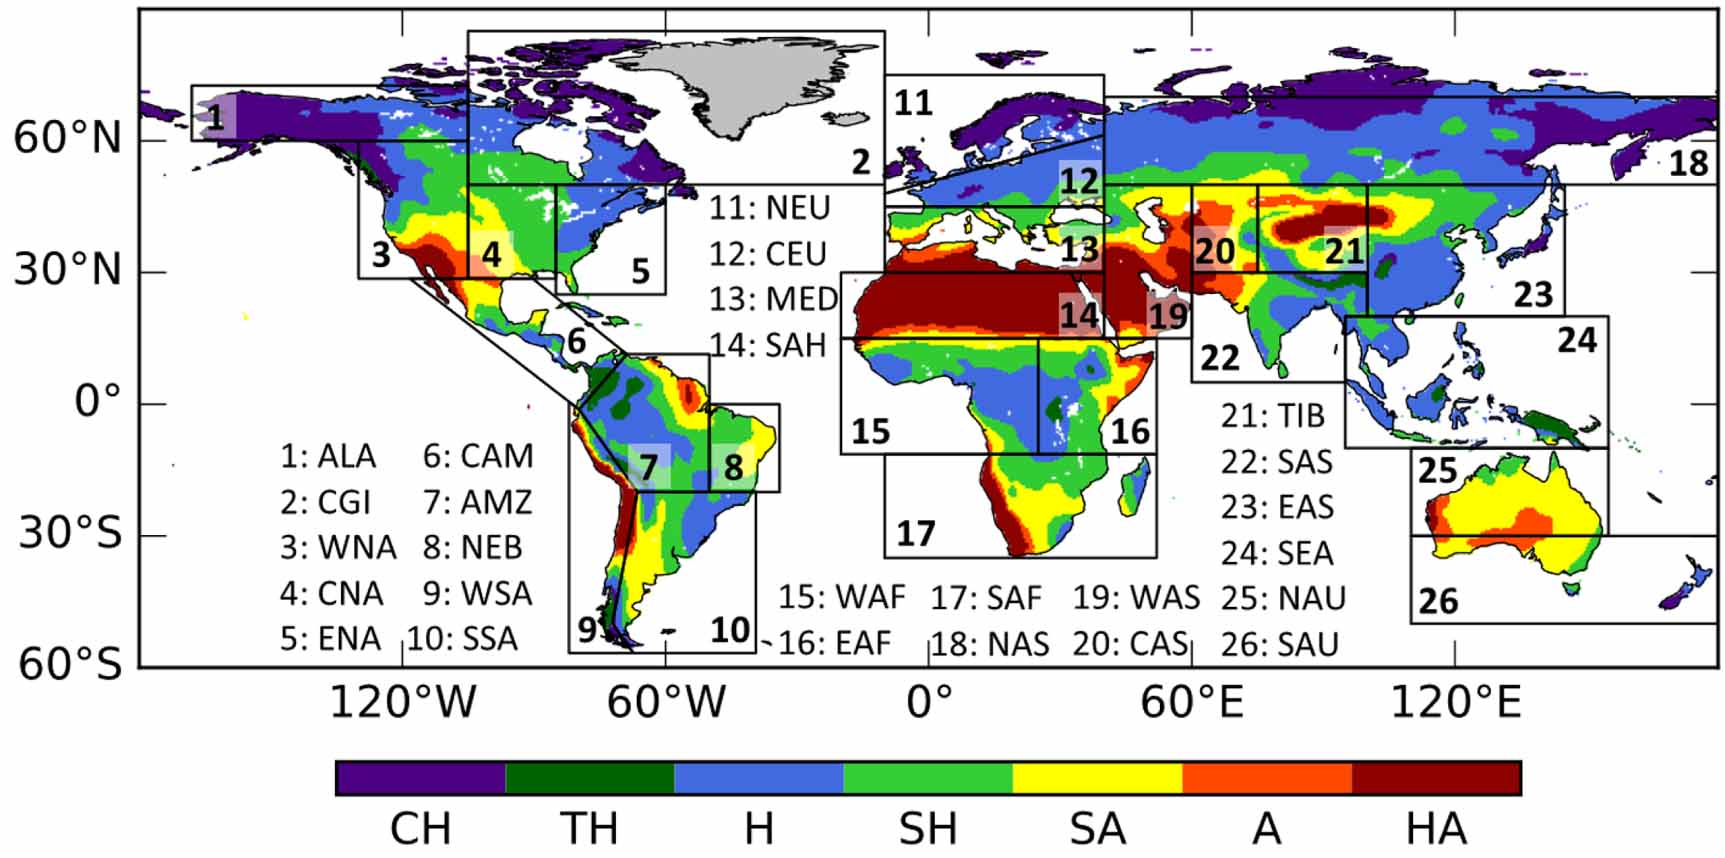
  is precipitation at the surface. Annual mean of net radiation and precipitation were used in the analysis as the framework is satisfied under steady-state condition. According to the nature of the framework, the change of the dryness index in a region potentially indicates shifts of the hydroclimatic regime rather than intra-annual variability (i.e. individual drought events). This implies long-term impacts on various sectors such as water, ecosystem, agriculture, and the broader human society. Figure 1 shows the seven climate regions classified by the Budyko framework based on the model mean of ALL experiment. Simulated precipitation and net radiation by each model are bi-linearly interpolated into 0.5° grids to calculate the dryness index. The analyses in this study are performed over terrestrial areas excluding Antarctica and Greenland. In addition, hyper-arid regions indicated in ALL are also excluded from the analysis.

Figure 1. Seven climate regions classified by Budyko aridity index and precipitation, CH: Cold Humid ( and
and  ), TH: Tropical Humid (
 and
and  ), H: Humid (
 ), SH: Semi-Humid (
 ), SA: Semi-Arid (
 ), A: Arid (
 ) and HA: Hyper-Arid (
 ). Boxes indicate IPCC AR5 reference regions called 26 SREX regions (IPCC, 2017).
Download figure:
Standard image High-resolution image3. Results
3.1. Model performance
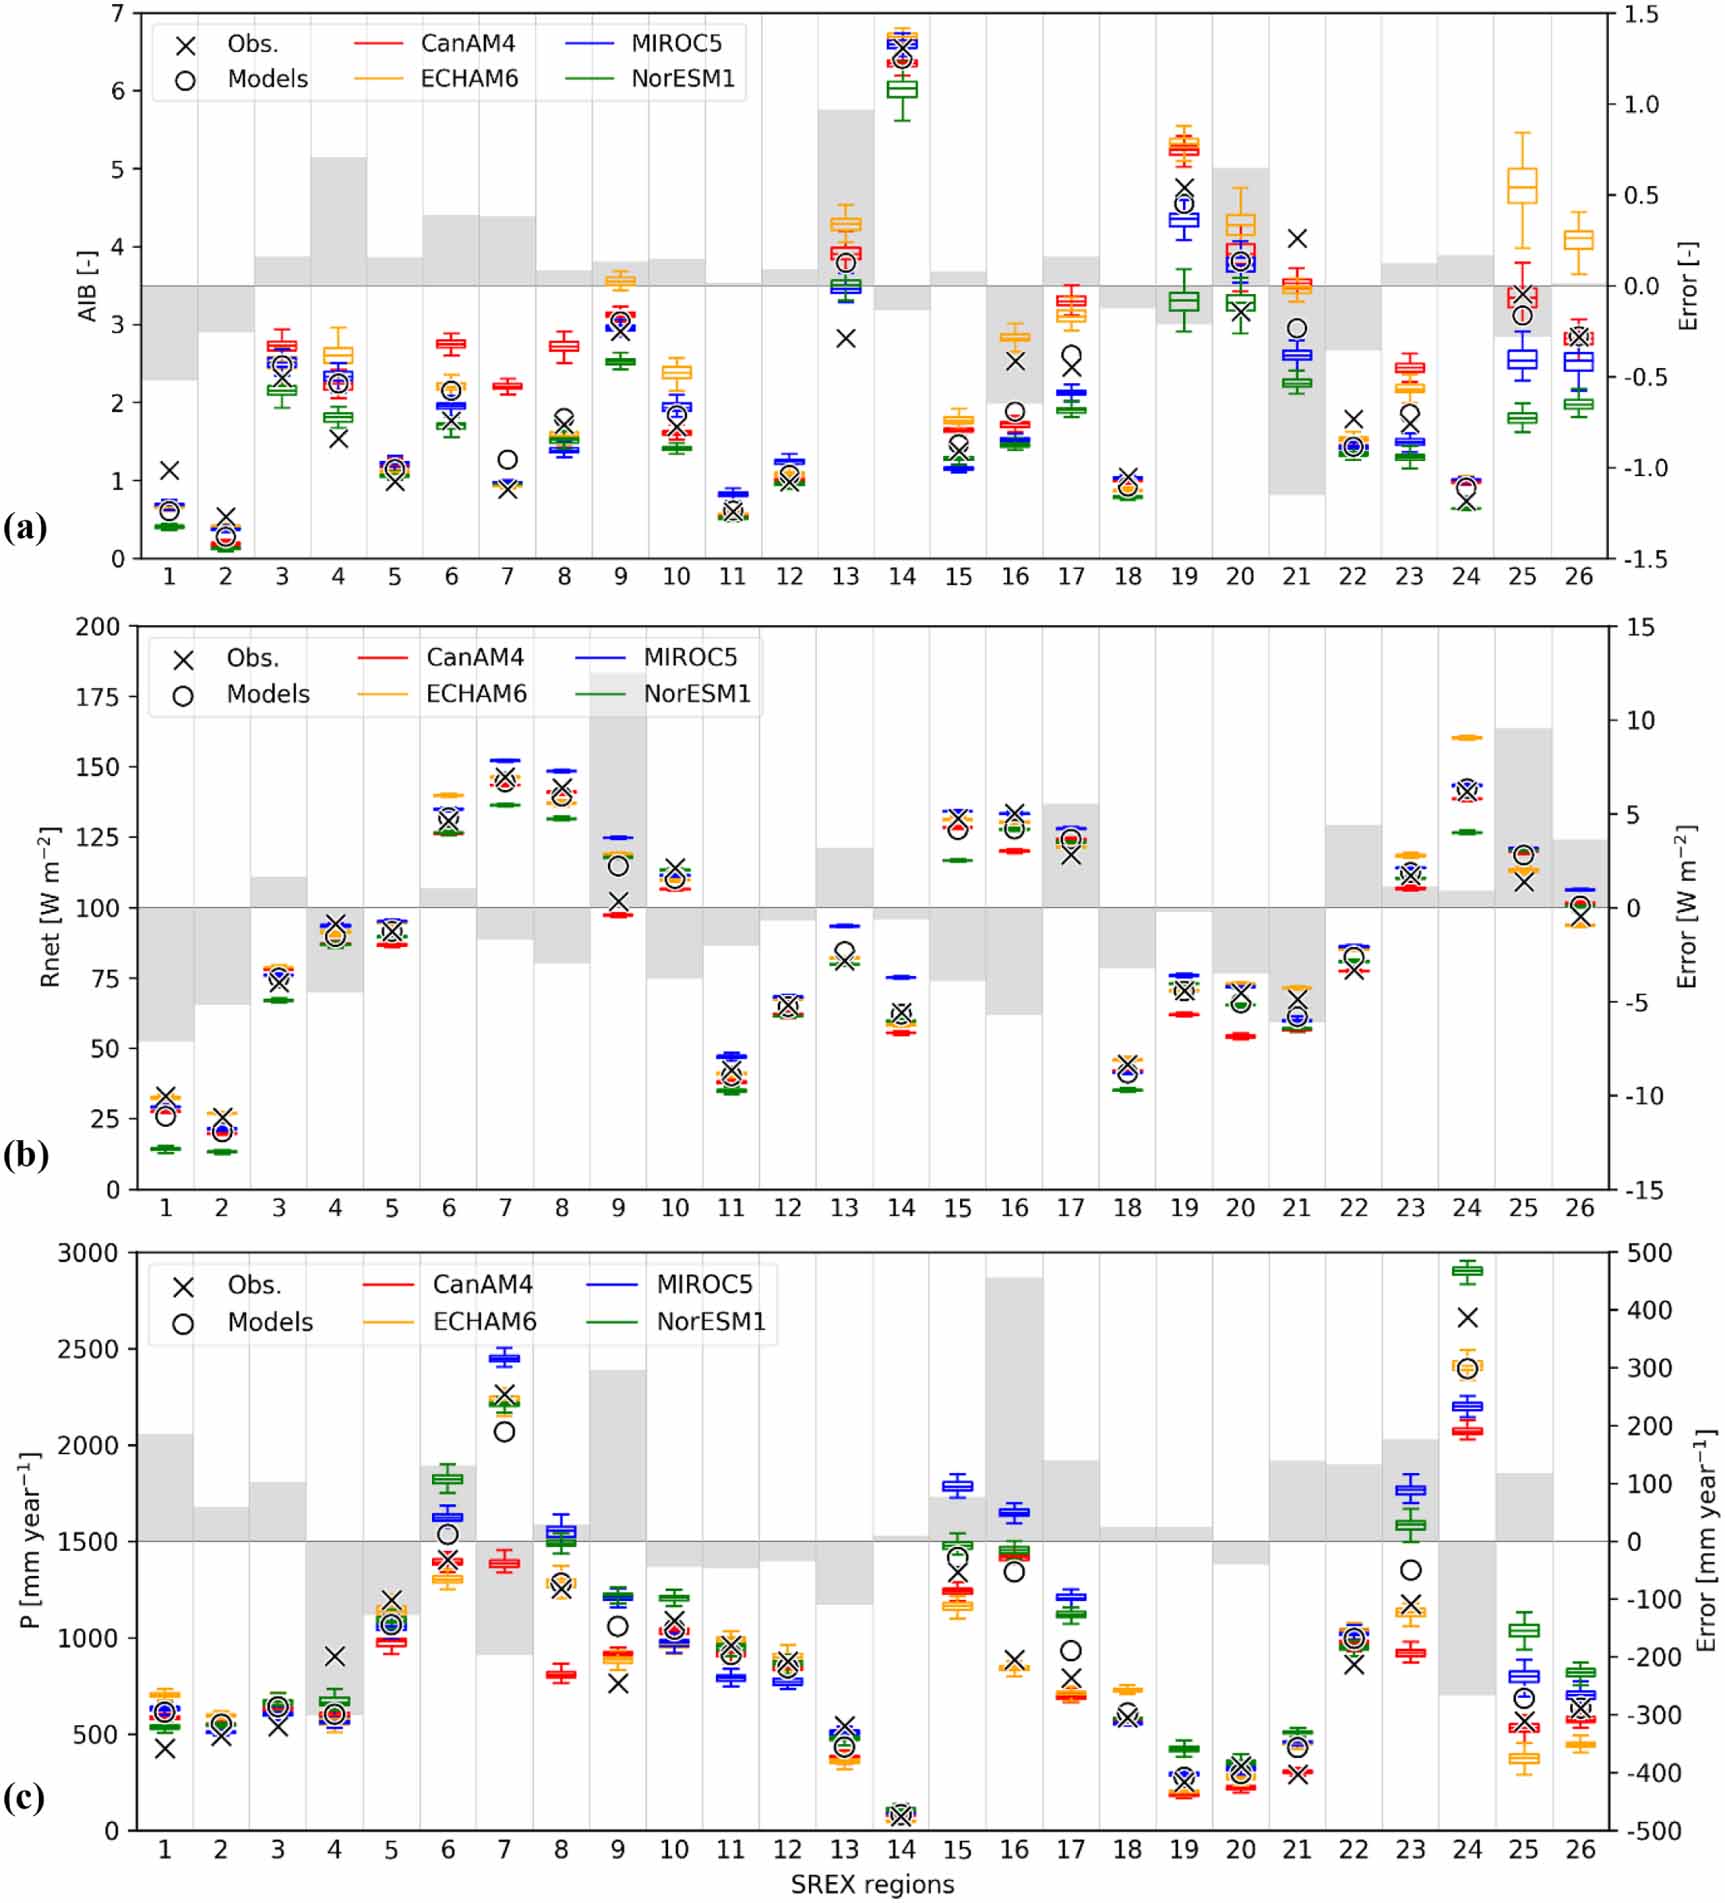
Observation and model-mean of four models of the decadal means of annual precipitation, net radiation of observation and aridity index are compared. The span is 2006 to 2015, and errors and relative errors of model-means are calculated for each variable (see supplementary figures S1–S3 (available online at stacks.iop.org/ERL/15/0940a7//mmedia)). Observations of precipitation and net radiation are calculated from monthly precipitation provided by Global Precipitation Climatology Project (GPCP; Adler et al 2003) and from upward/downward, shortwave/longwave radiations of EBAF-Surface Ed4.0 provided by Clouds and the Earth's Radiant Energy System (CERES; Kato et al 2018), respectively. Also, regional means of IPCC AR5 reference regions called SREX regions are calculated for each variable (figure 2).

Figure 2. Regional means of decadal-mean annual precipitation from 2006 to 2015 in 26 SREX regions. 'x' marks in (a), (b) and (c) indicate observation of aridity index, precipitation (GPCP) and net radiation (CERES), respectively, and 'o' marks show those of model means. Gray bars indicate absolute errors (right y-axis) of ensemble model means against observations. Box plots show model experiments, CanAM4 (red), ECHAM6 (orange), MIROC5 (blue) and NorESM1 (green), and each model have 100 ensemble members of decadal means. Bars in the boxes show the model average, and the bottom and the top of the box corresponds to the 1st and the 3rd quantiles, respectively. The lower and upper whiskers show the smallest and the largest members in the range of ![$\left[ {{Q_1} - IQR, {Q_3} - IQR} \right]$](https://content.cld.iop.org/journals/1748-9326/15/9/0940A7/revision1/erlab9db3ieqn10.gif) , respectively, where
, respectively, where  is interquartile range
  .
.
Download figure:
Standard image High-resolution imageDifferences between models and observations were larger in precipitation than in net radiation and aridity index, which implies precipitation can be the major source of uncertainty in the analysis. However, in general, it is reliable in terms of regional analysis, as the observed precipitation is within the spread of model ensembles in most regions, as is the aridity index (figure 2). In addition, simulated transitions of precipitation are compared to those of GPCP observations. Among the models selected in this study, only MIROC5 and NorESM1 possess 10 ensembles of long-span historical simulation. The overlapping span of GPCP precipitation observation and model simulations is 1979–2015, so decadal means of initial and final 10 years, 1979–1988 and 2006–2015, respectively, are compared to determine the reliability of the model projections on long-term transitions of precipitation. In general, the observational changes in between those two periods are within or close to the model spreads, and are well represented even in the regions where models show relatively larger absolute errors, e.g. region 7 (northeast of South America; AMZ in figure 1) or region 13 (Mediterranean; MED) (see supplementary figure S4).
3.2. Changes of aridity and decomposition to net radiation and precipitation
The transition to a different hydroclimatic regime, defined as the balance between available energy and water at the surface in this study, has a large spatial variability. The global distribution of the differences and change rates of the Budyko aridity index, net radiation and precipitation among three scenarios are illustrated in figures 3(a)–(d), (e)–(h) and (i)–(k), respectively. The statistical significance of the transition is tested for each model using a Student's t-test (p < 0.05). The analysis only includes the regions where at least 3 out of 4 models tested significant and show the same sign of changes. Hereinafter, 'significant' indicates satisfying the above condition.

Figure 3. (a) Ensemble mean of Budyko aridity index ( ) derived from ALL and the change rates [%] (b) from ALL to P15, (c) from ALL to P20, and (d) from P15 to P20. (e)–(h) and (i)–(l) are same for (a)–(d) but represent the annual mean net radiation (
![$\left[ {{\text{W }}{{\text{m}}^{ - 2}}} \right]$](https://content.cld.iop.org/journals/1748-9326/15/9/0940A7/revision1/erlab9db3ieqn19.gif) ) and precipitation (
) and precipitation (![$\lambda P \left[ {{\text{W }}{{\text{m}}^{ - 2}}} \right]$](https://content.cld.iop.org/journals/1748-9326/15/9/0940A7/revision1/erlab9db3ieqn20.gif) ), respectively. Dots indicate significant change, but they are omitted on the white-colored area, where change is relatively small. Hyper-arid regions and Greenland are filled with gray color. Regional boundaries over land represent the SREX regions (figure 1).
), respectively. Dots indicate significant change, but they are omitted on the white-colored area, where change is relatively small. Hyper-arid regions and Greenland are filled with gray color. Regional boundaries over land represent the SREX regions (figure 1).
Download figure:
Standard image High-resolution imageSignificant aridification from ALL to P20 is located over the Mediterranean, northern South America, southern Africa and the east coast of Australia, and corresponds with previous studies (e.g. Dai 2013, Lehner et al 2017, Lin et al 2018). The projected wetting trends over the substantial area in East Asia excluding southern part of China, are also consistent with Dai (2013) and Lehner et al (2017). However, in some regions, the trends in this study differ. For example, Dai et al (2013; RCP4.5) and Lehner et al (2017; 2 °C warming) demonstrate wetting trends over the Sahel and tropical archipelagos over Southeastern Asia, which are opposite to the results in the present study.
Net radiation increases in most of land areas over the northern hemisphere and tropics (figure 3). This is mainly due to rising net shortwave radiation over most terrestrial regions, while the changes of net longwave radiation are projected mostly to be negligible or negative (figure S5). Donohoe et al (2014) indicated a reduction in outgoing longwave radiation produced by greenhouse gases and recovery after several decades following the CO2 perturbation. Absorbed solar radiation increases are due to an augmentation of water vapor in the warmer atmosphere (Trenberth et al 2009, Donohoe et al 2013).
Our results suggest that the dominant factor of aridification varies among regions. Both net radiation and precipitation shifts to dryer condition in southern and northwestern area in North America under both P15 and P20, which results in a high increase rate in aridity index. In the Mediterranean, aridification is driven by an increase in net radiation under P15, but higher rates of declines in precipitation are projected under P20. In the Sahel, West Africa, the eastern side of Central Africa and the western side of South Africa, changes in net radiation are negligible and decreases in precipitation is the main factor in both P15 and P20. In the remaining drying areas in Africa, namely western side of Central Africa and eastern side of South Africa, an increase in net radiation is dominant. In Asia, both net radiation and precipitation are projected to increase, and aridification in some regions is driven by a higher increase rate in net radiation. This study also shows decreasing aridity in substantial areas of the North American and Eurasian continents due to a high rate of increasing precipitation. The Horn of Africa and India are also regions where significant declines of aridity are projected under P15, and a strengthened trend under P20 because of an increase in precipitation due to an additional 0.5 °C of warming. This tendency is similar to the results of previous studies (e.g. Lehner et al 2017, Liu et al 2018). These regions and the Indian Ocean (not shown) are within a known wetting zone (Utsumi et al 2016), and there is increased wetting under P20 warming compared to P15.
Change rates in the aridity index from ALL to P20 have a geographical distribution similar to that of ALL to P15, but impacts of an additional 0.5 °C demonstrate large variance. An increase in net radiation is mostly limited to the regions of high latitude (60ºN∼), and generally precipitation is dominant for significant changes in aridity from P15 to P20. Among the regions which show an increase in aridity in P15, northern regions of South America, the Mediterranean, and southern Africa become increasingly arid. In particular, impacts of an additional 0.5 °C of warming are comparable to those from ALL to P15. In contrast, a significant decrease in aridity is projected in the Sahel and tropical archipelagos across southeastern Asia due to negligible changes in net radiation and a significant increase in precipitation in the regions. This non-monotonic change in aridity index, an increase under P15 and a decrease by a further 0.5 °C of warming, is driven by precipitation.
3.3. Regional aridity changes and decomposed impacts of net radiation and precipitation changes
Figure 4 shows decomposed impacts of the climate factors for the Budyko framework and their model spreads. Spatial means of  and
and  in each scenario are shown for four regions out of 26 SREX regions: (a) the Amazon River basin (AMZ, zone 7), (b) the Mediterranean coast (MED, zone 13), (c) South Africa (SAF, zone 17), and (d) southern Australia and New Zealand (SAU, zone 26). All four regions are projected to experience large increases in aridity under P15 and P20, and from the additional 0.5 °C warming.
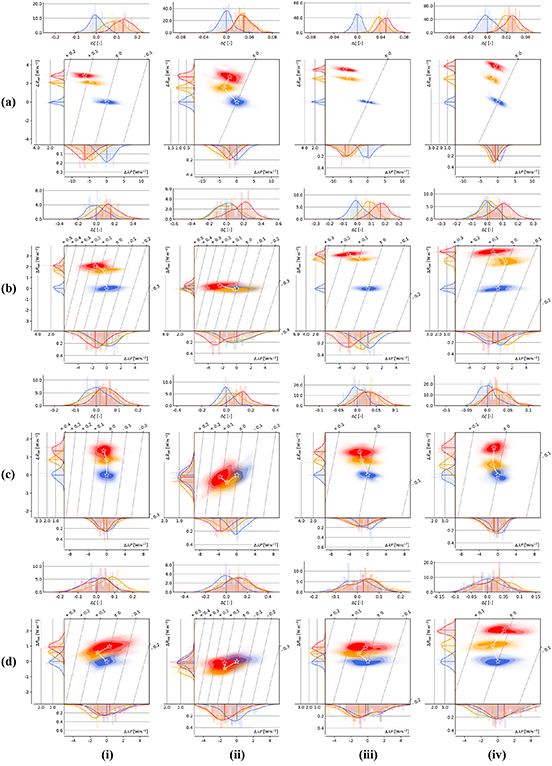
Figure 4. Regional average of  ,
,  and
and  for (a) zone 7 AMZ (Amazon river basin), (b) 13 MED (the Meditteranean coast), (c) 17 SAF (South Africa) and (d) 26 SAU (southern Australia and New Zealand). Smeared parts in the box demonstrate the density of 100 ensemble members of regional average of decadal-mean
  (abscissa) and
  (ordinate) under three scenarios. Density is calculated based on gaussian kernel density estimation. Stars indicate the ensemble means. Dotted lines are the contours of aridity index. The upper abscissa and right ordinate are scales relative to ALL. Histograms on the left, bottom and top show the ensemble spreads of
  ,
,  and
and  , respectively, and the vertical (horizontal) axis of the histogram on the left (bottom) corresponds to the vertical (horizontal) axis of the box. The curves on the histograms are kernel density estimation, and the straight lines are the ensemble means under each scenario. Blue, yellow and red colors correspond to ALL, P15 and P20, respectively.
Download figure:
Standard image High-resolution imageIn AMZ (zone 7; figure 4(a)), an increase in net radiation is projected for all models, and the shifts of probability distributions between the scenarios are apparently larger than the inter-model differences. This implies the high reliability of the projected transitions of net radiation in this region. Conversely, precipitation changes are less clear compared with the model spread. Two models (CanAM4 and MIROC5) exhibit precipitation increasing from P15 to P20, while the others show a decrease. This highlights the uncertainty in the impacts of 0.5 °C warming on precipitation in this region. As a result, in CanAM4 and MIROC5, increases in  and
and  from P15 to P20 nearly cancel each other and the changes in aridity index are negligible.
MED (zone 13; figure 4(b)) is a region where the impacts of an additional 0.5 °C warming on aridification is projected to be among the largest in the world. By 1.5 °C warming,  does not change significantly in CanAM4 and ECHAM6 and even increases in NorESM1, but from P15 to P20, models project a sudden decrease in
  . In the three models other than ECHAM6, the increase in net radiation due to the additional 0.5 °C warming is relatively small. This implies that the dominant hydroclimatic factors in the aridification mechanism of this region are different for each P15 and P20 warming scenario.
In SAF (zone 17; figure 4(c)), the four models show a relatively large discrepancy in projecting the balance between  and
and  . However, all models project that the climate becomes drier under P15 and even more so in P20. Under P15, MIROC5 and NorESM both project increases in
  and decreases in
  , while the projected change in
  is negligible in CanAM4 and
  decreases in ECHAM6. The differences between P20 and P15 are larger in CanAM4 and ECHAM6 due to a relatively larger decrease in
  . In these two models, the aridity increases from P15 to P20 and is larger than or comparable to that of ALL to P15.
The change in SAU (figure 4(d)) follows a strongly nonlinear trajectory of aridification toward a wetter climate after P15, mainly due to a precipitation response to an additional 0.5 °C warming. The three models, excluding ECHAM6, exhibit similar trends in both  and
and  , as well as the trajectory of Budyko aridity index. The projection consistency of the increased aridity and also the dominant factors of aridification indicate the robustness of the projections over this region. It is speculated that this nonlinear change in precipitation over this region may be driven by the change in Australian monsoon circulation, but there still remains uncertainty in those projected changes in circulation (Chevuturi et al 2018).
3.4. Changes in return period of dry-year
Droughts cause serious impacts on our society and natural environment, including water scarcity (Falkenmark 2013), ecosystem degradation (Dregne et al 2002, Fensham et al 2009), and severe and frequent wildfires (Taufik et al 2017, Stephens et al 2018). Increasing impacts of these extremes have been reported under the changing climate (Laurance et al 2001, Allen et al 2010). In this section, we discuss the occurrence of dry condition changes due to warming by using a large ensemble of 1000 years per model per scenario (figure 5). Note that the analysis in this study aims to assess the drying shift in terms of annual mean hydroclimate (i.e. in steady state) rather than the changes in the risk of individual drought disasters. Aridity index of 100-year return period under ALL scenario ( ) is calculated at the 0.5-degree grids globally. Then the return periods of
  are estimated for P15 and P20 scenarios, respectively. Similarly, the aridity index of 100-year return period under P15 scenario is calculated, and associated return period is estimated under P20 scenario. Gumbel distribution is applied to these analyses (see supplement for the selection of probability function). Return period of the aridity index for once in 100-year is estimated by the Bootstrap method with 100 iterations, and figure 5 shows the average of the samples. Ratio of the 95% confidence interval width to the average for return period, which is an uncertainty measure, proves the robustness of the results. The results indicate that the uncertainty tends to be lower in cold and higher in dry area (figure S6).

Figure 5. Return period [year] of dry-year-in-a-century (a) P15, (b) P20 and (c) P20 based on the threshold derived under ALL, ALL and P15, respectively, and (d) aridity index of 100-year return period. The return period was calculated based on the ensemble mean of occurrence probability of each model. Gumbel distribution was used to determine threshold and occurrence probability of dry-year (see supplementary material for details). The other visualization details are the same as figure 3.
Download figure:
Standard image High-resolution image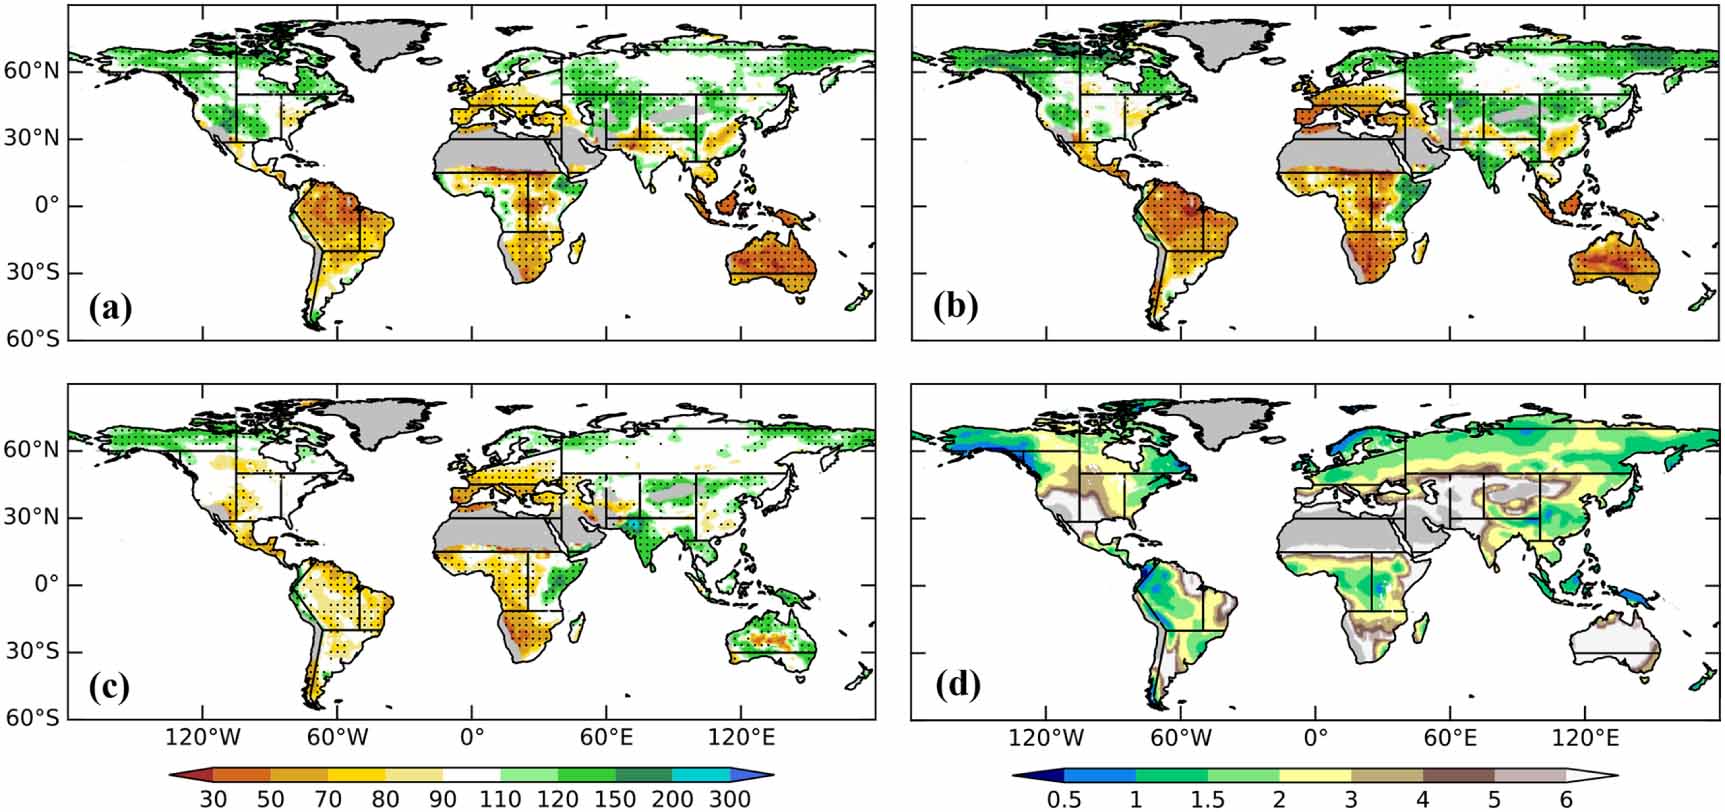
Under P15 (figure 5(a)), northern South America, Central Africa, the southern Arabian Peninsula, and most of the Southeastern Asia islands will struggle with extremely dry years (i.e. once-in-a-century) frequently more than twice those without warming, and a relatively weak increasing of dry-year frequency occurs over the Mediterranean, southern Africa, southern China and Australia.
Under P20 (figure 5(b)), some of the aforementioned areas where increased aridity is most pronounced (i.e. northern South America, the Sahel and Central Africa), are projected to experience even more frequent dry conditions than in P15. Over most of the Mediterranean, northern South America and Africa, dry-year becomes more than twice as frequent as without warming. Moreover, similar to the change in aridity index, the impact of an additional 0.5 °C warming is largest over the Mediterranean regions (figure 5(c)). In some regions, such as eastern North America, the Horn of Africa, the southern Arabian Peninsula, northern India, Southeastern Asia, and Australia, dry-year becomes less frequent in P20 than in P15, while other regions are projected to see similar changes in P15 and P20. For example, dry conditions will occur 10%–50% less frequently over most of North America, except the east coast, the Horn of Africa, and a large portion of the Eurasian continent. These projected changes in dry year frequency are similar to the projected changes in the Budyko aridity index (figures 3(b)–(d)).
Although the spatial distribution of projected dry year frequency changes are similar to those displayed by the aridity increases, there are some regional differences. For example, in the northern part of South America, the region where the aridity index increases most rapidly (rate higher than 8%), is limited to the small area in the northeast (figure 3(b)). However, a large increase in dry year frequency is shown in the majority of northern South America. In Australia, the increase in dry year frequency under P15 is less drastic in the eastern part (figure 5(a)), although aridity increase was largest in the region (figure 3(b)). Also, in Central Africa, the increasing in occurrence of dry conditions is considerably more severe than other regions, although the change rate in aridity index is not as high. In contrast, in the eastern United States, dry year increases by a factor of 1.5 to 2 under P15 and P20, but the increase in aridity is insignificant. Over Canada, the Horn of Africa, India and other projected wetting regions in Asia, the changes in the frequency of dry-year are insignificant or negligible in P15 (figure 5(a)).
4. Summary and concluding remarks
This study investigates how 1.5 and 2 °C global warming will alter the terrestrial hydroclimate in terms of the balance between available energy and water at the surface. Under P15 and P20 scenarios, projected changes of aridity and the underlying hydroclimatic factors (i.e. precipitation and net radiation) are investigated, and the frequency of extreme dry-year is also estimated. Significant and intense drying trends are projected in northern South America, the Mediterranean, the Sahel, Southern Africa, Southeastern Asia and Australia, with good consistency across models. In the Sahel, Southeastern Asia, and all of Australia, increases in precipitation under P20 relative to P15 may offset aridity increases from ALL to P15. These trends are caused by nonlinear changes in precipitation and are consistently projected among the models, which conforms with previous studies (e.g. Lehner et al 2017, Liu et al 2018).
Our results also demonstrate that all four models simulate a drier planet under both P15 and P20 ― the aridity index increases by 2% to more than 8%, and extreme dry-year becomes 2–3 times more likely to happen ― over the Mediterranean, large areas of Western Europe, northern South America and South Africa. Compared to a 1.5 °C of warming, a + 2 °C world will result in more frequent dry year and more severe aridification across much of the terrestrial world. Considering the potential impacts over those regions, this further supports the need to limit global warming to 1.5 °C.
Further, over Australia, the non-monotonic projected change in aridity infers that Australia's drying trend from ALL to P15 is reversed from P15 to P20. In other regions, wetter conditions are projected for P15 and P20, although model variability exists for intensity and spatial distribution. This implies that the projected warming does not necessarily lead to a globally drier climate or more frequent dry conditions. The multi-model large ensemble experiments exhibit significant spatial variability, suggesting that the impacts of an additional 0.5 °C warming must receive careful attention for certain regions.
Acknowledgments
H Kim acknowledges the Grant-in-Aid for Specially promoted Research 16H06291 from Japan Society for the Promotion of Science. K Kim and H Shiogama were supported by TOUGOU JPMXD0717935457 (MEXT, Japan) and ERTDF 2-1904 (Environmental Restoration and Conservation Agency, Japan). L Lierhammer was supported by funding from the Bundesministerium für Bildung und Forschung (BMBF). D Mitchell was funded under the NERC HAPPI-Health project (NE/R009554/1). The MIROC5 simulations were performed using the Earth Simulator at JAMSTEC and the NEC SX at NIES. Authors appreciate Paul Dirmeyer for constructive and thoughtful comments.
Data availability statement
The data that support the findings of this study are openly available at the following DOIs. HAPPI experiments by CanAM4 is doi:10.26050/WDCC/HAPPI-global-CanAM4, by ECHAM6.3-LR is doi:10.26050/WDCC/HAPPI-global-ECHAM6.3_v2, by MIROC5 is doi:10.26050/WDCC/HAPPI-global-MIROC5, and by NorESM1 is doi:10.26050/WDCC/HAPPI-global-NorESM1-HAPPI.